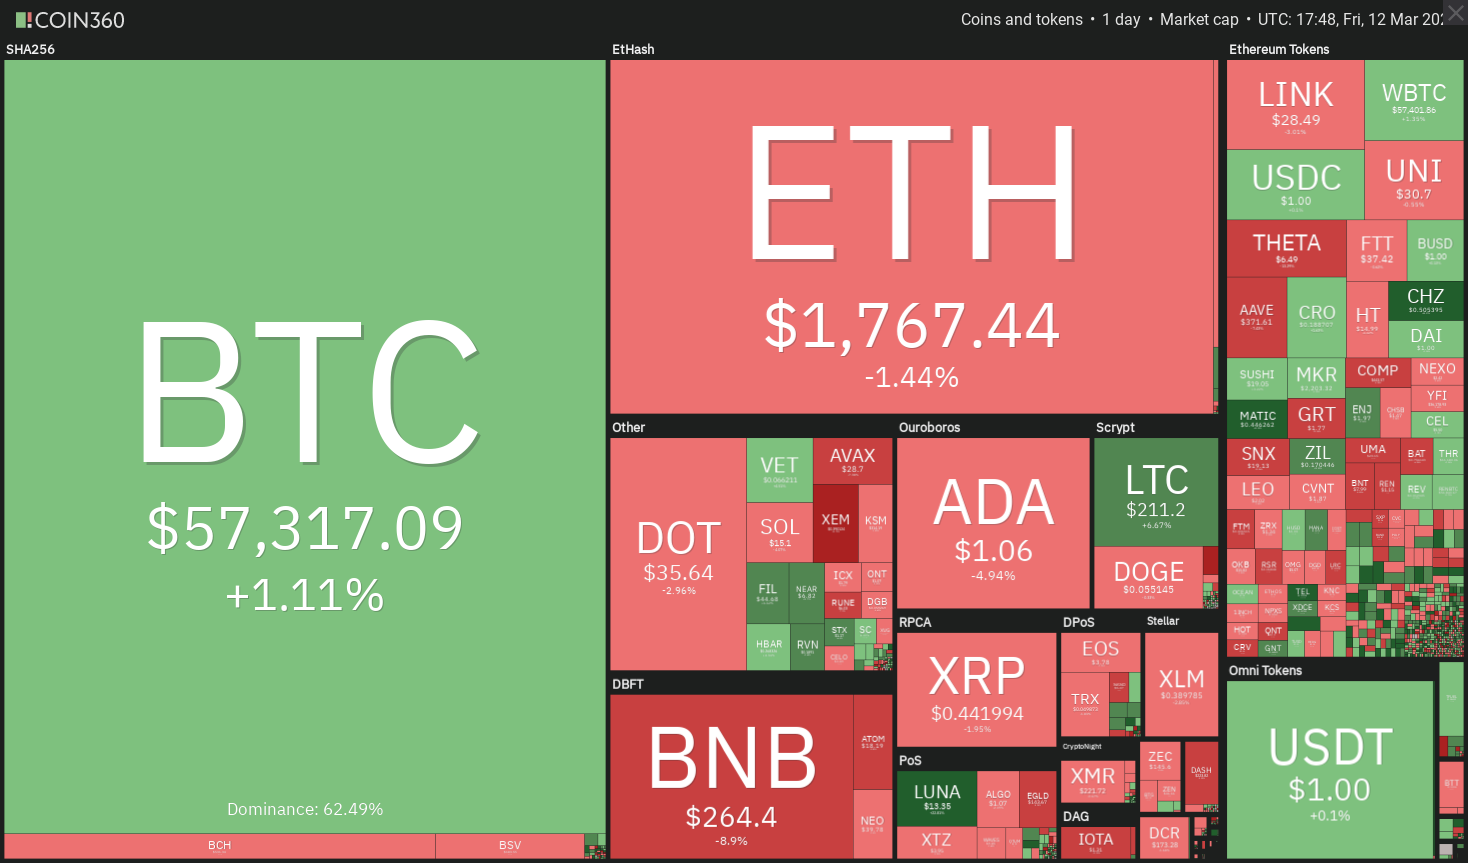
Bitcoin (BTC) missed hitting a new all-time high on March 11 by just a whisker as Oracle Corporation denied rumors that it had purchased about 72,000 Bitcoin. This suggests that traders could be looking for signs of greater institutional adoption to boost Bitcoin’s price further.
One of the main factors that may have kept several institutional investors at bay is the lack of regulatory clarity but this could be on the verge of changing.
In a recent interview on the Thinking Crypto podcast, Hester Peirce, a commissioner at the United States Securities and Exchange Commission, said that Gary Gensler’s nomination to be the President of the SEC could lead to greater regulatory clarity being given to the crypto sector.
If that happens, several institutional investors may jump in and purchase Bitcoin. Another possible instrument that may attract both institutions and retail investors is a Bitcoin ETF. Just this week, New York-based asset manager WisdomTree joined the list of aspirants who are seeking the SEC’s approval to launch a Bitcoin ETF.
Crypto traders are likely to keep a close watch on these developments as they could prove bullish for Bitcoin. Until the next trigger, will Bitcoin and altcoins remain in a range or correct to lower support levels? Let’s study the charts of the top-10 cryptocurrencies to find out.
BTC/USD
Bitcoin turned down from just below the all-time high today as the bears tried to pull the price down. However, the long tail on the daily candlestick shows aggressive buying on dips. The upsloping 20-day exponential moving average ($51,414) and the relative strength index (RSI) above 68 suggest the path of least resistance is to the upside.
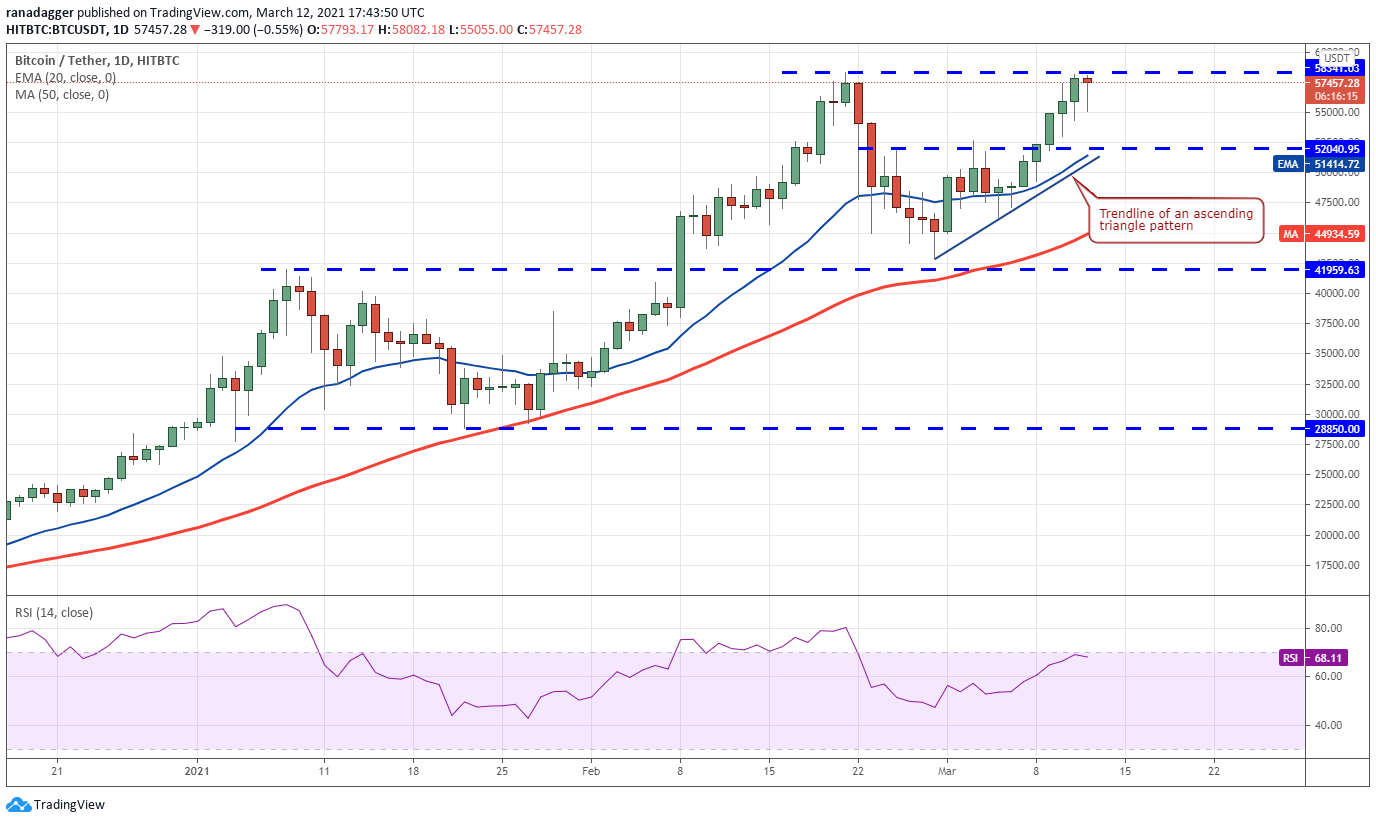
If the bulls can drive and sustain the price above $58,341.03, the uptrend could resume. The next target objective on the upside is $72,112.
Contrary to this assumption, if the BTC/USD pair once again turns down from $58,341.03, it will suggest the bears are aggressively defending the higher levels.
If the bears can sink the price below the 20-day EMA, the short-term traders may book profits and that could pull the price down to the 50-day simple moving average ($44,934).
A break below this support could result in a drop to the critical support at $41,959.63. This is an important level to watch out for because if it cracks, the advantage will shift in favor of the bears.
ETH/USD
The bears are attempting to stall the relief rally at the 78.6% Fibonacci retracement level at $1,879.915. The long tail on March 11 candlestick suggests the bulls bought the dips near the 20-day EMA ($1,692), but they could not build up on the recovery as Ether (ETH) has turned down today.
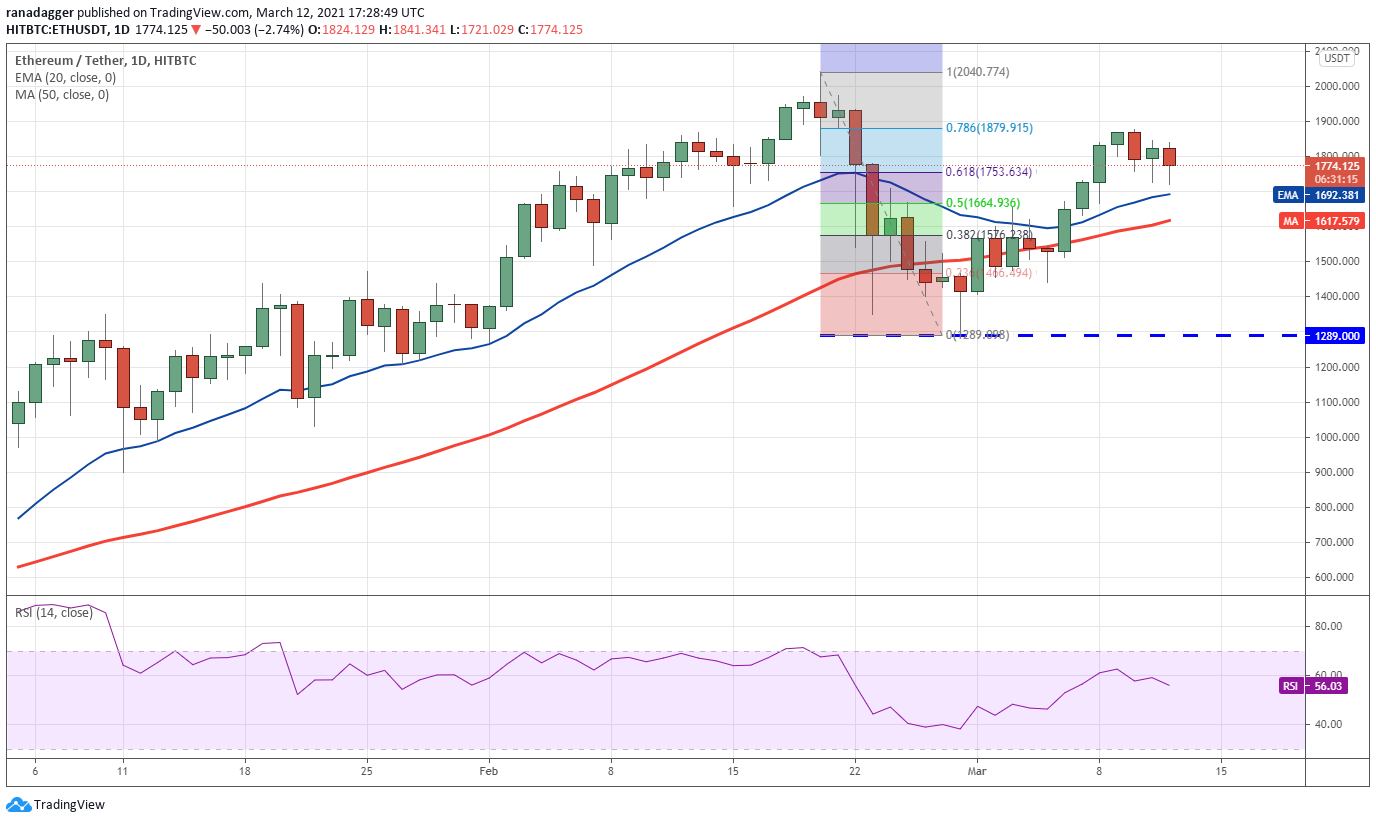
If the price rebounds off the moving averages, it will suggest that traders continue to buy the dips. The bulls will then again try to push the price above $1,879.91 and retest the all-time high at $2,040.77. A breakout and close above this level could clear the path for a rally to $2,614.
The marginally upsloping moving averages and the RSI just above the midpoint suggest a minor advantage to the buyers. However, if the bears sink the price below the moving averages, it may attract profit-booking from short-term traders. That could result in a fall to $1,455 and then to $1,289.
BNB/USD
Binance Coin (BNB) rallied above the $309.49 overhead resistance on March 11 but the bulls could not sustain the higher levels as seen from the long wick on the day’s candlestick. The bears tried to sink the price below the 20-day EMA ($239) today but the long tail on the candlestick suggests aggressive buying at lower levels.
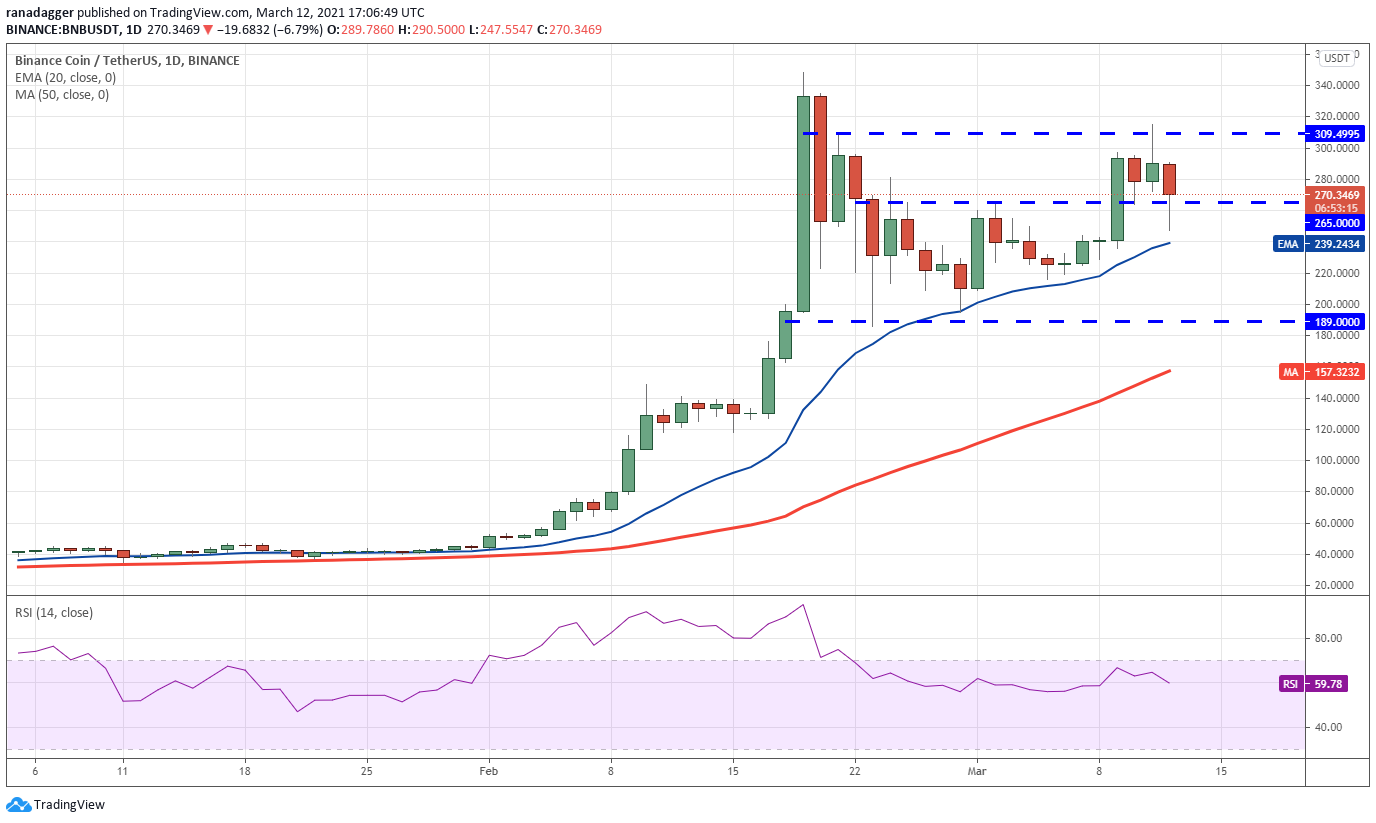
Traders are buying the dips and selling the rallies. This could keep the BNB/USD pair range-bound between $265 and $309.49 for a few days. Both moving averages are sloping up and the RSI is in the positive zone, which suggests the bulls have the upper hand.
If buyers can push and sustain the price above $309.49, the pair could rally to the all-time high at $348.69. Above this level, the pair may extend its up-move to $410 and then $500.
Conversely, if the bears sink and sustain the price below the 20-day EMA, the pair may drop to $215 and then $189.
ADA/USD
Cardano (ADA) has dropped to the support of the $1.0683 to $1.2303 range. This is an important level to keep an eye on, hence the bulls are likely to defend it aggressively. If the price rebounds off this level, the altcoin may consolidate in the range for a few more days.
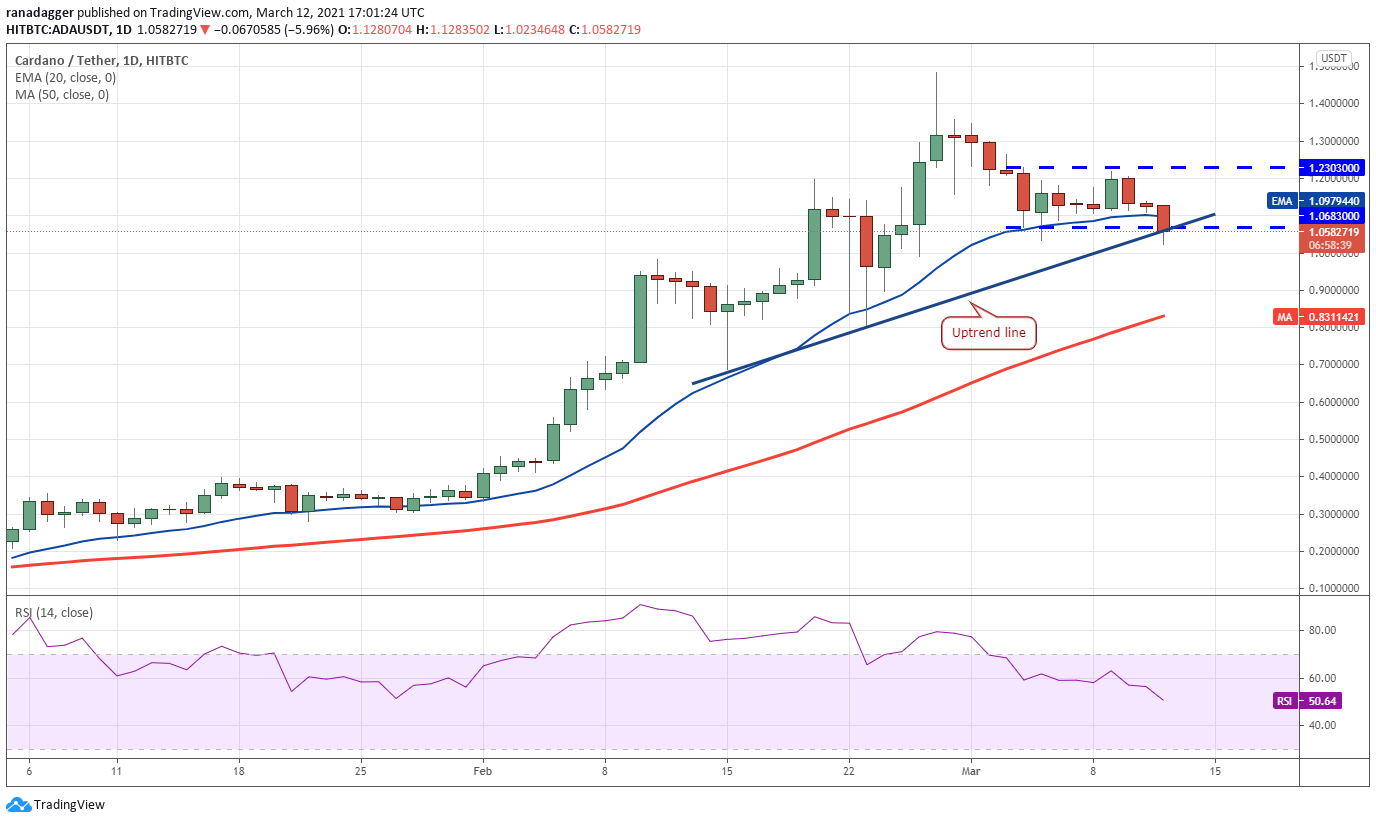
A break above or below the range could start the next trending move. The flat 20-day EMA ($1.09) and the RSI near the midpoint suggest equal opportunities to the bulls and the bears.
If the price rises from the current levels and breaks above $1.2303, it will suggest the bulls have the upper hand. That could result in a rally to $1.35 and then $1.4852.
On the other hand, if the bears sink and sustain the price below $1.0683, the ADA/USD pair could drop to the 50-day SMA ($0.831).
DOT/USD
Polkadot’s (DOT) breakout of the symmetrical triangle fizzled out at $39.60 on March 10. The bears dragged the price back into the triangle today, but the long tail on the day’s candlestick suggests the bulls are buying on dips to the 20-day EMA ($34.40).
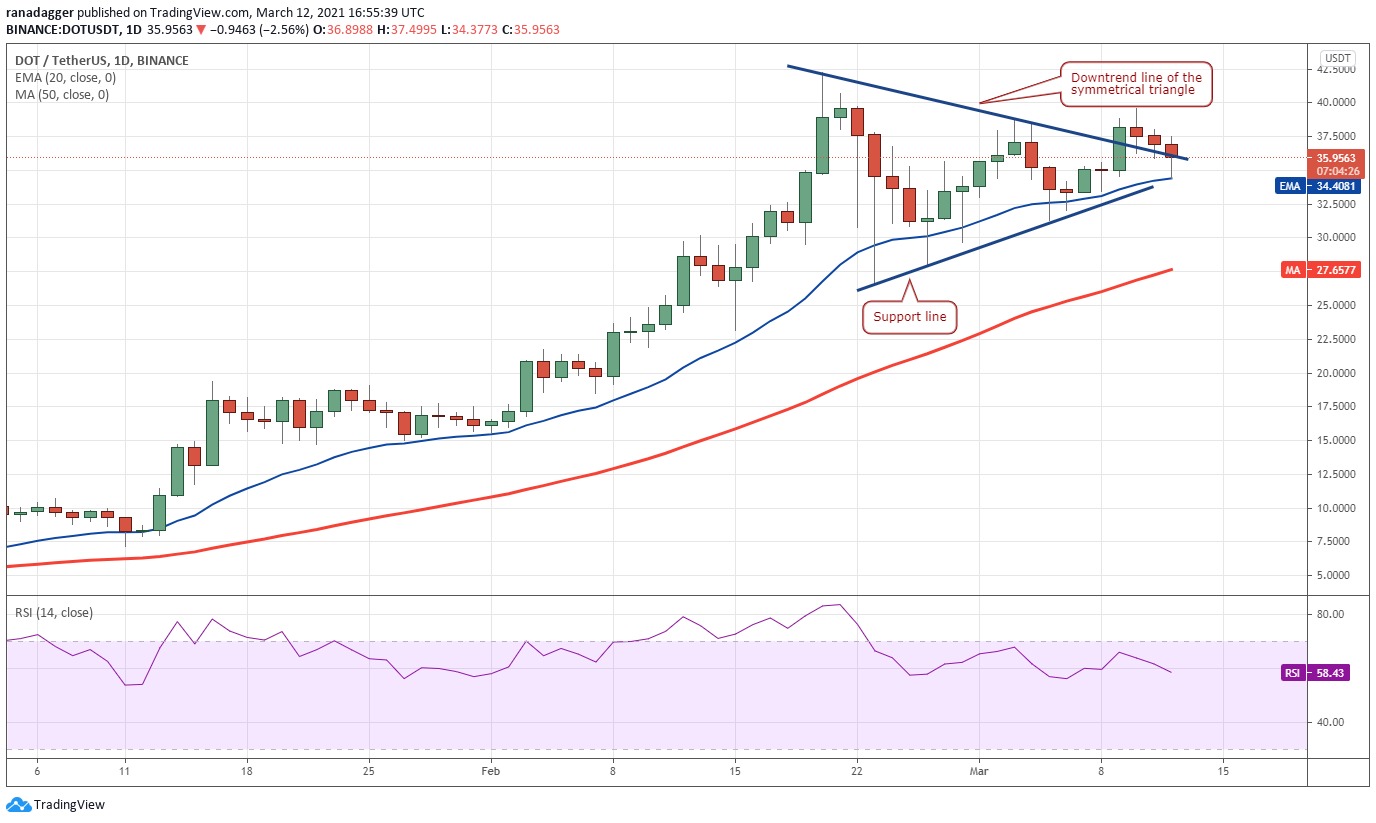
If the price turns up from the current level and rises above $39.60, it will suggest strong demand at lower levels. The pair could then retest the all-time high at $42.28. A break above this resistance may push the price to the pattern target at $52.50.
On the contrary, if the price sustains inside the triangle, the bears will try to sink the DOT/USD pair below the support line. Such a move could intensify the selling and pull the price down to the 50-day SMA ($27.65).
XRP/USD
XRP turned down from the $0.50 overhead resistance and broke below the 20-day EMA ($0.464) on March 10. This suggests a lack of demand at higher levels. However, the bulls are presently trying to defend the 50-day SMA ($0.445).
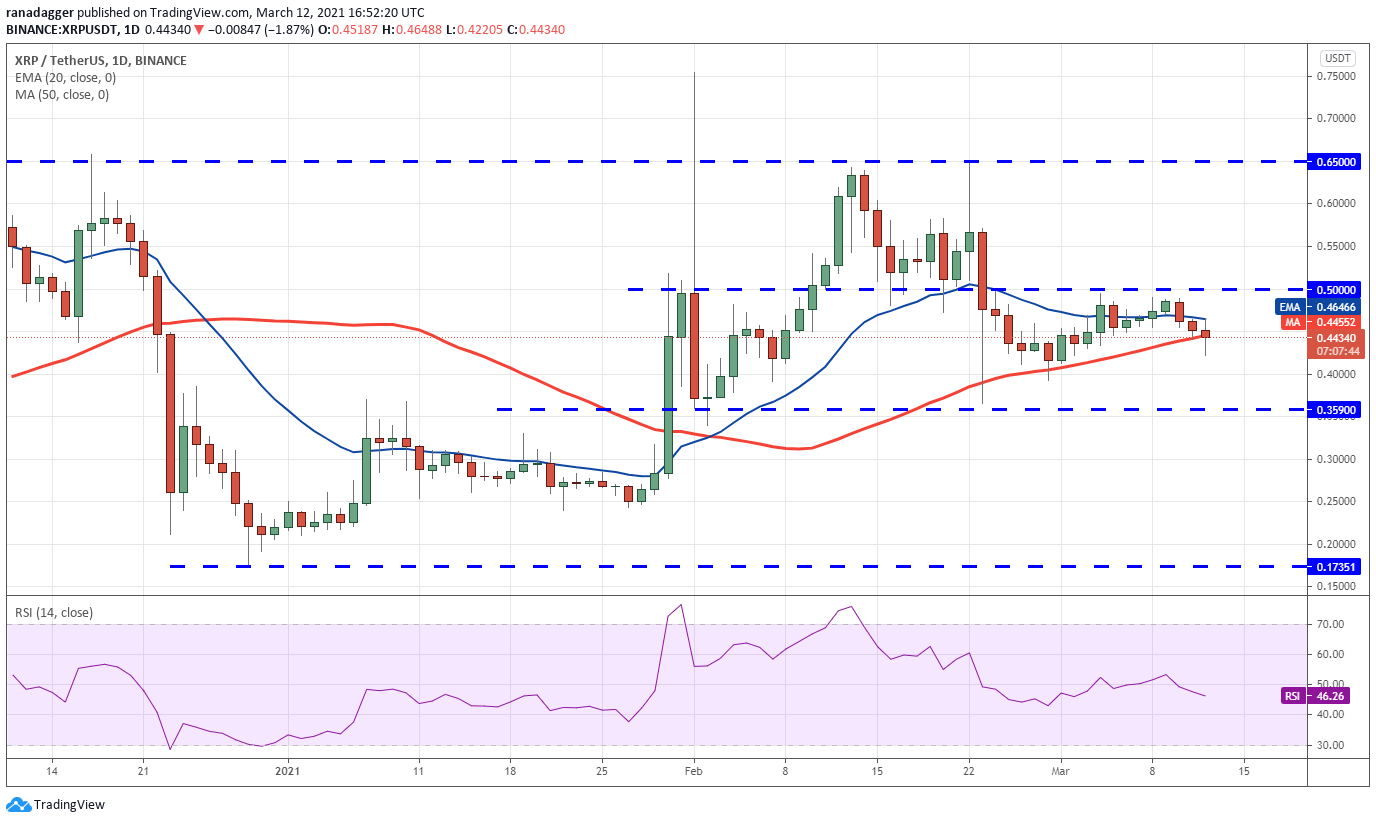
If they manage to push the price above the 20-day EMA, the XRP/USD pair may rise to $0.50. A break above this resistance could attract buying that may drive the price to $0.57 and then $0.65.
Alternatively, if the bears sustain the price below the 50-day SMA, the pair could drop to $0.392 and then to $0.359. The 20-day EMA is flat and the RSI is just below the midpoint, indicating a possible range-bound action in the short term.
UNI/USD
The long tail on March 11 and today’s candlestick suggests the bulls are buying the dips. Traders may now try to propel Uniswap (UNI) above the $33 to $34.92 overhead resistance zone.

If they succeed, the UNI/USD pair could start the next leg of the uptrend that may reach $46 and then $50. The rising moving averages and the RSI in the positive territory indicate the bulls are in command.
However, if the price turns down from the current level or the overhead resistance and breaks below the 20-day EMA ($27.90), short-term traders may book profits. That may drag the pair down to the 50-day SMA ($22.13).
LTC/USD
Litecoin’s (LTC) tight consolidation between the $205.18 overhead resistance and the 20-day EMA ($192) resolved to the upside today. This suggests the demand from the bulls has exceeded the will of bearish traders.
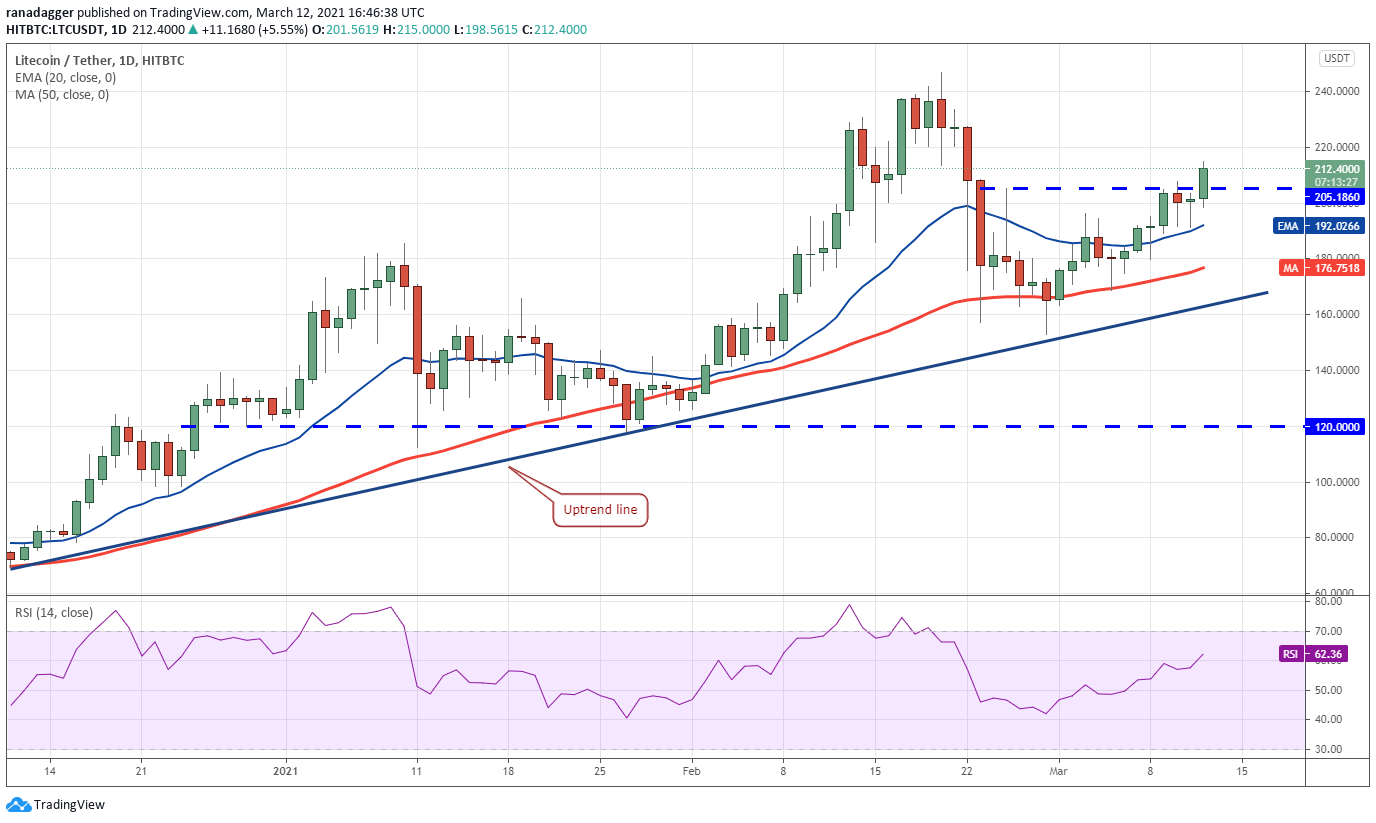
The bulls will now try to push the price to $246.96. The 20-day EMA has started to turn up and the RSI has risen above 62, which suggests the bulls have the upper hand.
On the contrary, if the LTC/USD pair fails to sustain above $246.96, it will indicate the bears are selling at higher levels.
That may trap the aggressive bulls, who may cover their positions if the pair breaks below the 20-day EMA. The bears may gain the upper hand if the pair plummets below the uptrend line.
LINK/USD
Chainlink (LINK) dipped below the 20-day EMA ($28.99) today, but the bulls are defending the 50-day SMA ($27.53). A strong bounce off this level will suggest the bulls continue to buy the dip. The buyers will then try to propel the price above the $32 overhead resistance.
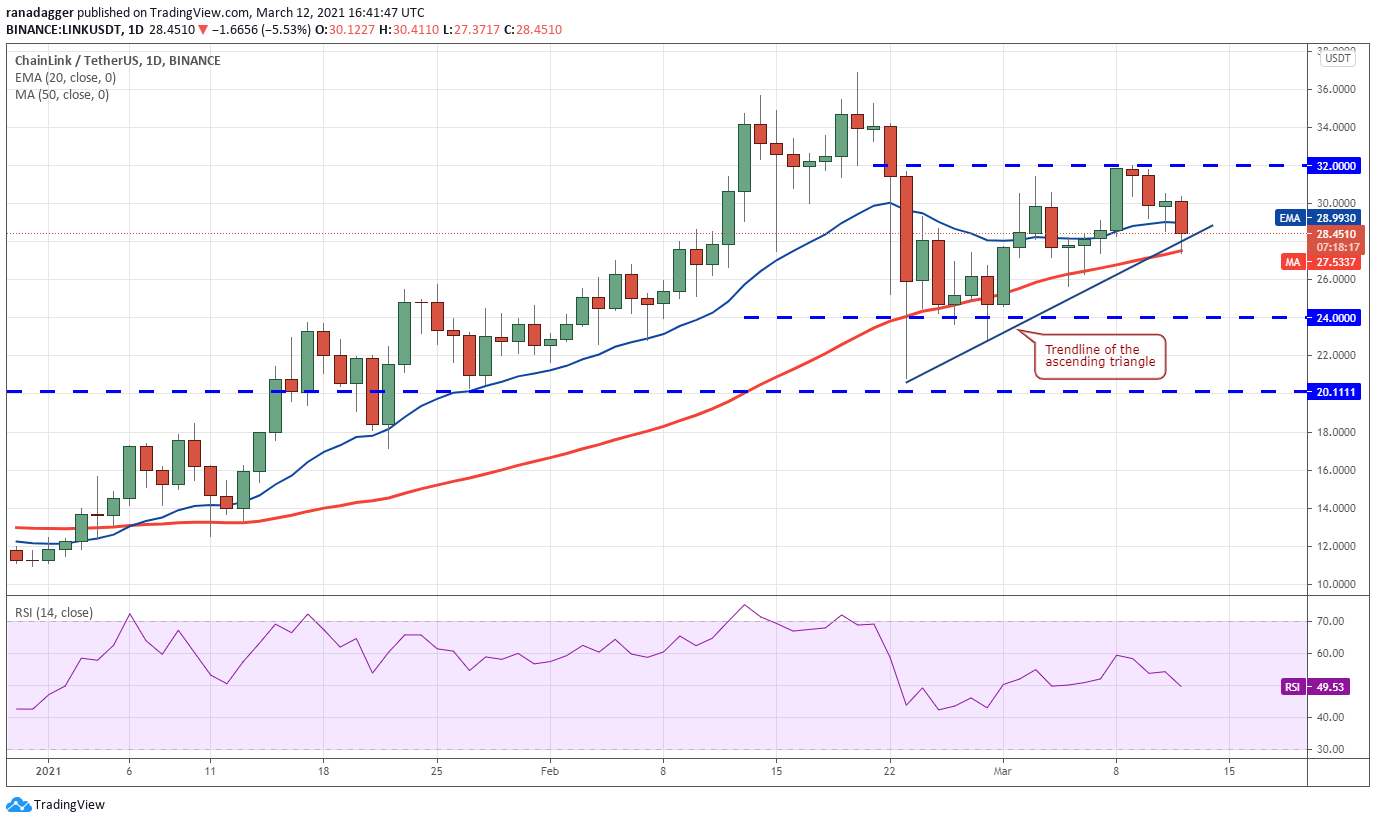
If they succeed, the LINK/USD pair will complete a bullish ascending triangle pattern that may attract buying from traders. The pattern target of this setup is $43.19, but the rise may face stiff resistance at the current all-time high at $36.93.
This bullish view will be invalidated if the price drops and sustains below the moving averages. The pair could then decline to $24 and then to $20.11. The flat moving averages and the RSI near the midpoint suggest a few days of range-bound action.
BCH/USD
The failure of the bulls to push Bitcoin Cash (BCH) above the $560 overhead resistance attracted profit-booking by short-term traders. However, the long tail on the daily candlestick suggests the bulls are continuing to buy the dips.
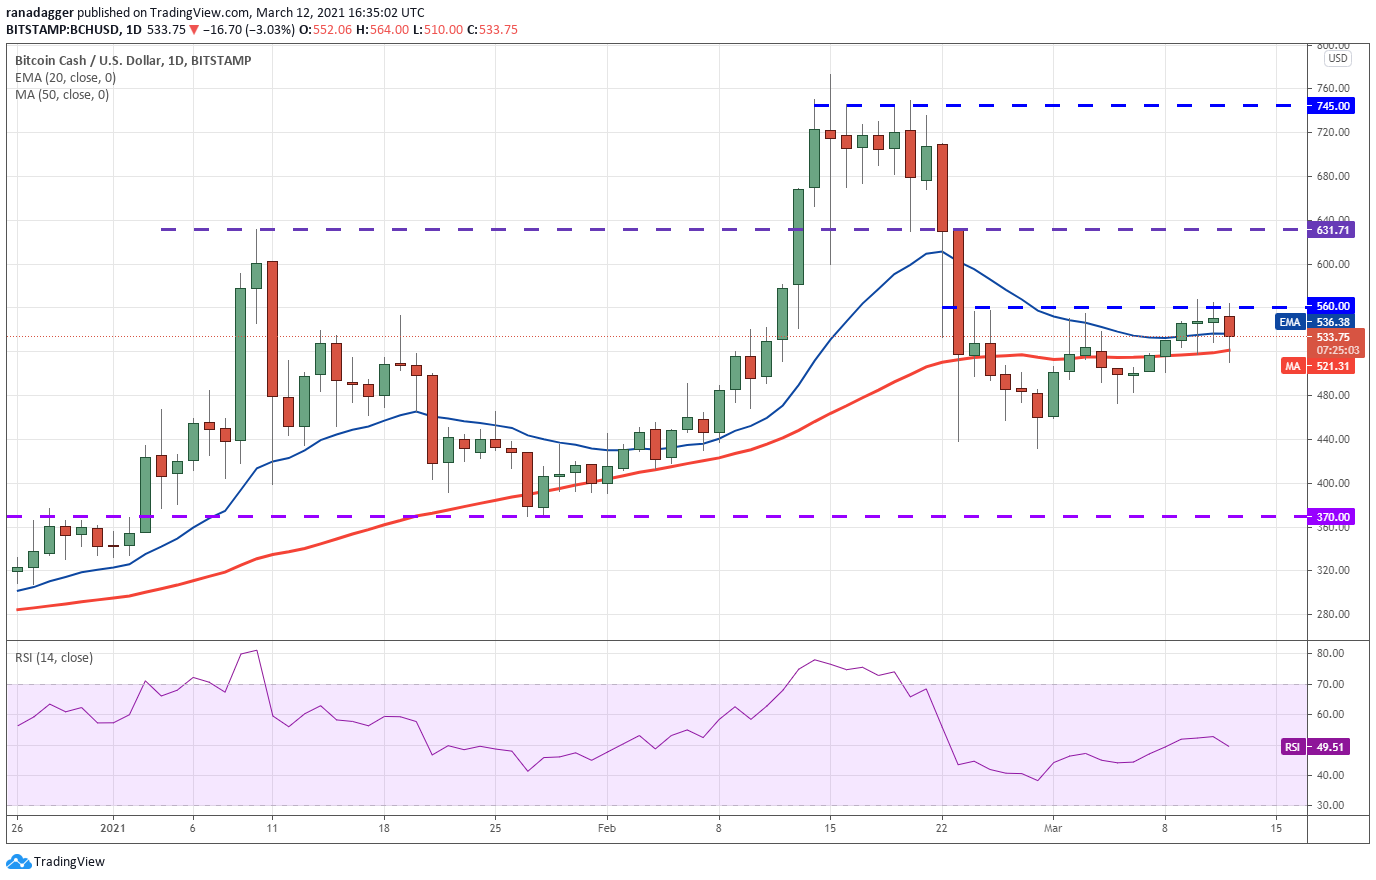
The flat moving averages and the RSI near the midpoint show a balance between supply and demand.
This equilibrium may shift in favor of the bulls if they can drive the BCH/USD pair above $560. Such a move will suggest that the bulls have absorbed the supply. That could start the next leg of the up-move to $631.71 and then $745.
Conversely, if the pair sustains below the moving averages, it will suggest the bears have overpowered the dip buyers. Such a move could result in a drop to $472.72 and then $432.02.
The views and opinions expressed here are solely those of the author and do not necessarily reflect the views of Cointelegraph. Every investment and trading move involves risk. You should conduct your own research when making a decision.
Market data is provided by HitBTC exchange.


