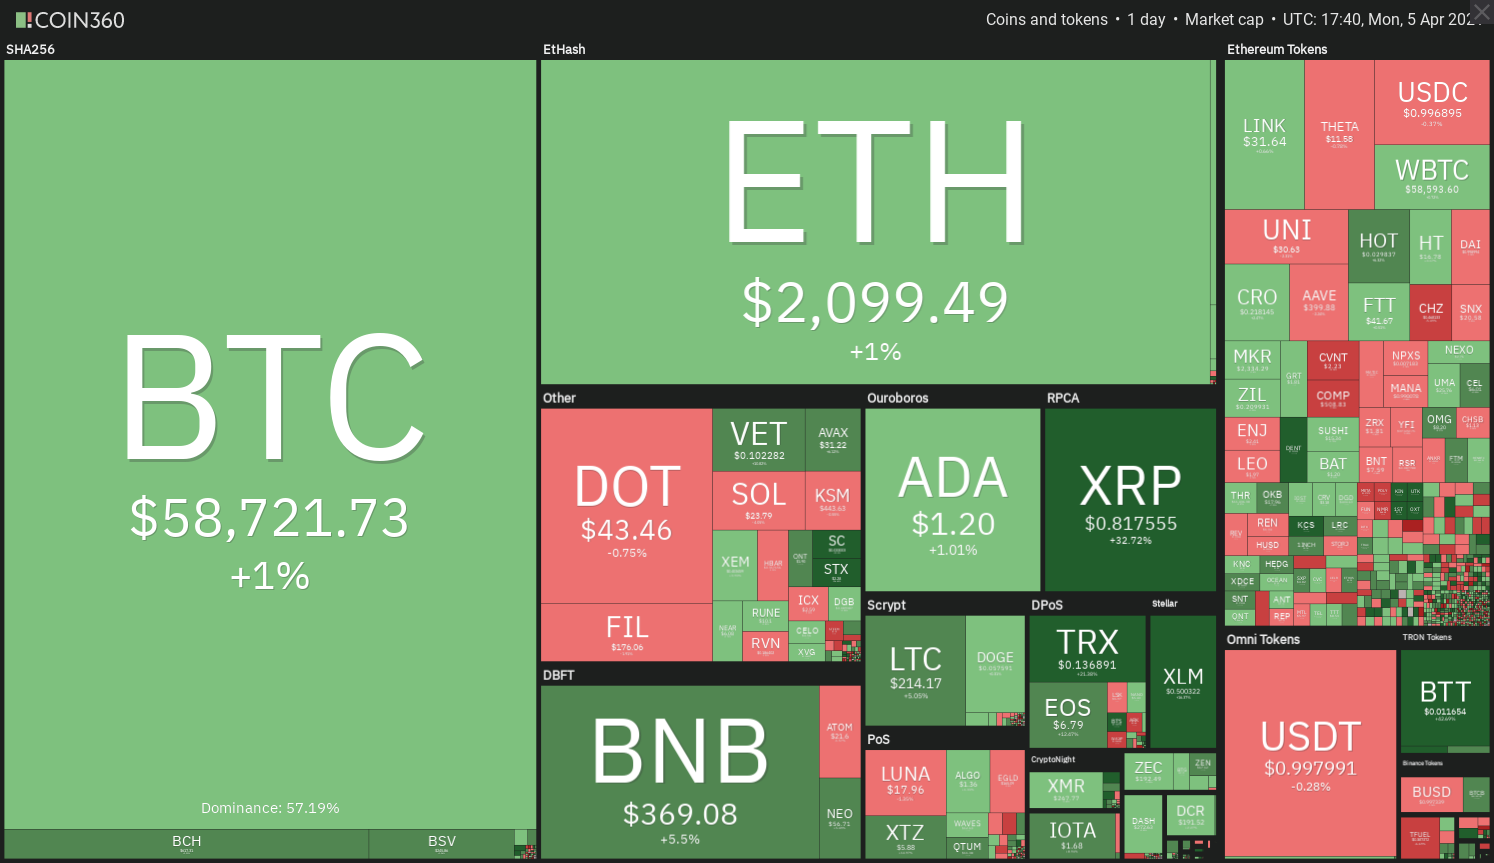
The total crypto market capitalization reached the important milestone of $2 trillion on April 5. As cryptocurrencies increase in value, they are likely to attract further investments from institutional investors because they can no longer afford to neglect it.
Less than three months ago, the crypto market had reached the $1 trillion in market cap for the first time ever. This rate of growth shows that investors are hugely bullish on the potential of the sector and the ones who delay their investment decisions may have to enter at much higher levels.
Ark Invest founder and CEO Cathie Wood is well known for identifying disruptive technologies and the firm is backing Bitcoin (BTC) to do just that. Yassine Elmandjra, a crypto asset analyst at Ark, said Bitcoin was “100 times better” than gold, hence he believes Bitcoin will rise 10-fold from the current market capitalization of $1 trillion to match gold’s $10-trillion market cap.
For Bitcoin to continue its northward journey, the institutions will have to continue pumping money into it. Purpose Bitcoin ETF, Canada’s first licensed Bitcoin exchange-traded fund (ETF) launched two months ago and currently, it holds 16,462 BTC.
If a Bitcoin ETF gets the approval of the regulators in the United States, it could attract huge investments, dwarfing the inflows into the Purpose Bitcoin ETF.
The crypto story has widened beyond Bitcoin. Data from business analytics firm CB Insights showed crypto and blockchain technology-focused startups received $2.6 billion in funding in Q1 2021. This is way above the total funding of $2.3 billion received in 2020, indicating the growing interest in the sector.
So the question on the minds of most investors is whether or not the crypto market will be able to sustain its current momentum. Let’s analyze the charts of the top-10 cryptocurrencies to find out.
BTC/USDT
Bitcoin has bounced off the 20-day exponential moving average ($56,750) today, which suggests that the sentiment remains positive and the bulls are buying on every minor dip.
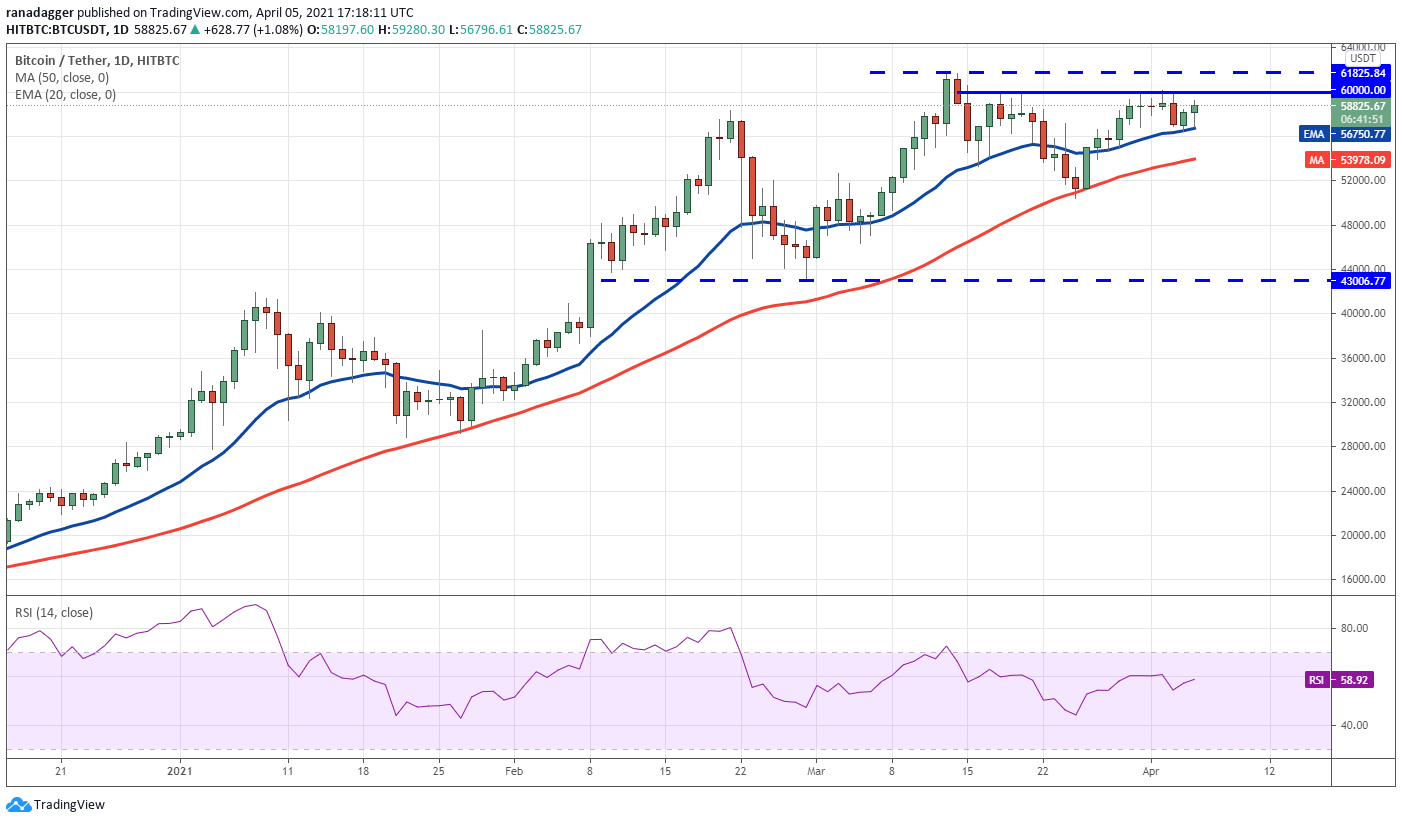
The buyers will now try to push the price above the $60,000 to $61,825.84 overhead resistance zone. If they succeed, it could open the doors for a rally to $69,540 and then $79,566.
However, the bears are unlikely to give up easily. They will once again try to stall the rally in the resistance zone. If that happens, the possibility of a break below the 20-day EMA increases.
That could result in a drop to the critical support at the 50-day simple moving average ($53,978). If the bears sink the price below the 50-day SMA, the pair could drop to the next support at $50,460.02.
ETH/USDT
Ether (ETH) made a new all-time high at $2,144.59 on April 2. However, the bulls could not build upon this move as the bears sold aggressively and pulled the price back below the breakout level at $2,040.77 on April 3.
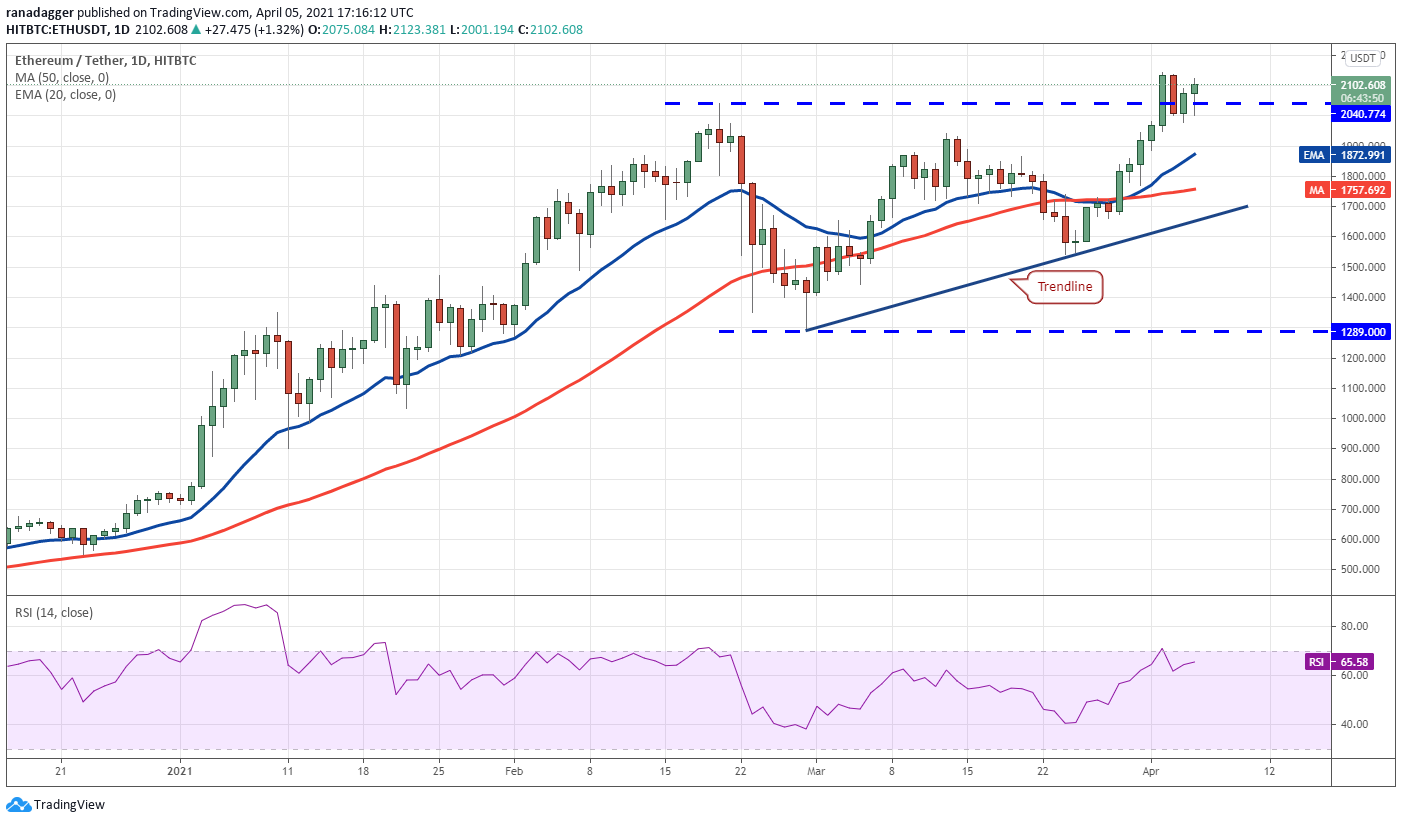
Since then, both the bulls and the bears have been battling it out near $2,040.77. While the bulls are attempting to flip this level into support, the bears are trying to pull the price below it and trap the bulls.
The rising 20-day EMA ($1,872) and the relative strength index (RSI) above 65 suggest the bulls have the upper hand. If the buyers succeed in pushing the price above $2,144.59, the ETH/USDT pair could start the next leg of the uptrend that may reach $2,618.14.
Contrary to this assumption, if the bears pull the price below $1,977, the pair could drop to the 20-day EMA. A break below this level will suggest the bullish momentum has weakened and could result in a decline to the trendline.
BNB/USDT
Binance Coin (BNB) cleared the $348.69 to $356.98 overhead resistance zone today and made a new all-time high. Whenever an asset class hits a new all-time high, it is a sign of strength because it shows that traders are buying at higher levels as they expect the rally to extend further.
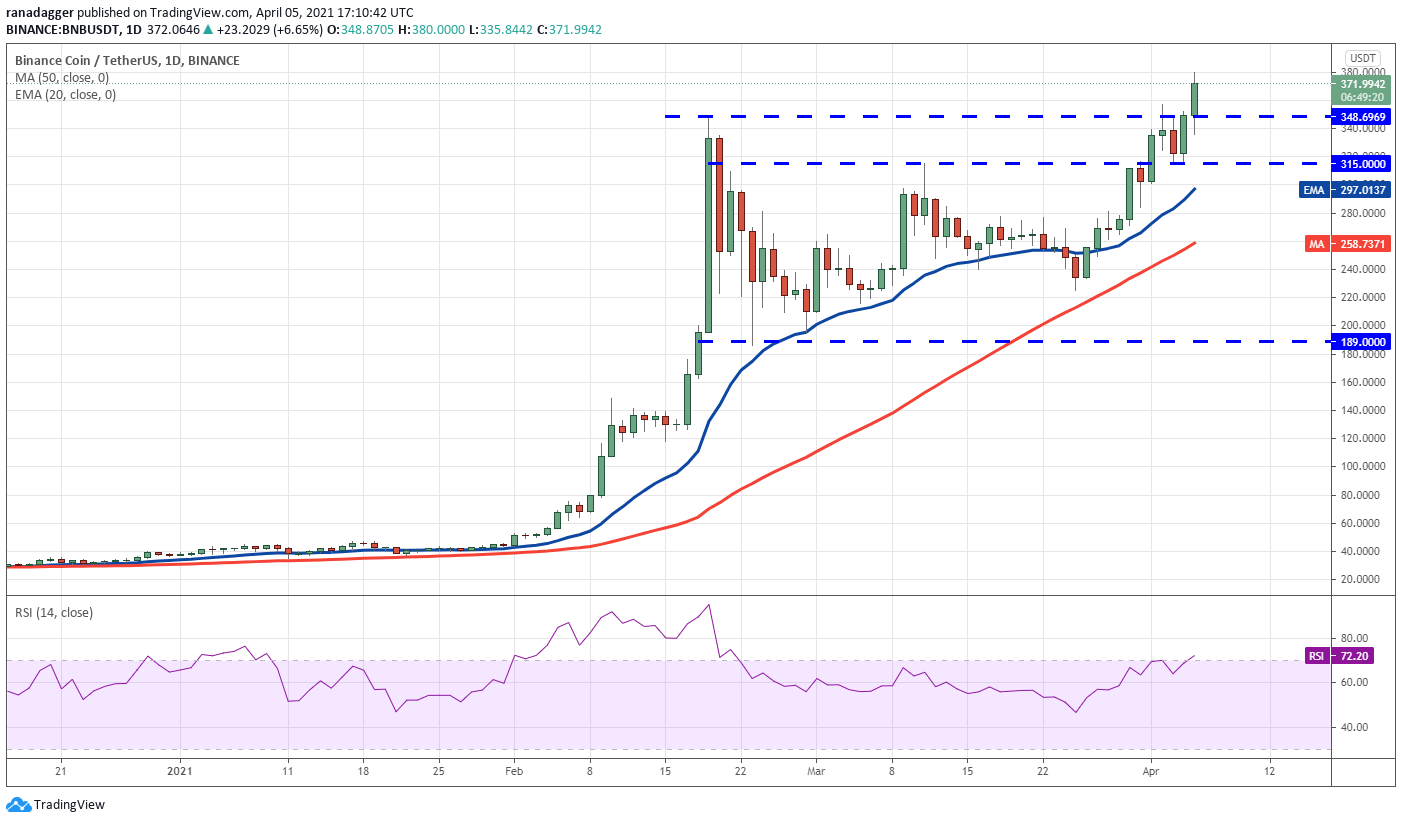
Both moving averages are sloping up and the RSI has risen into the overbought territory, indicating the path of least resistance is to the upside. The BNB/USDT pair could now rally to its target objective at $400 and then $430.
This positive view will invalidate if the price reverses direction and breaks below the 20-day EMA ($297). Such a move will suggest that traders are aggressively booking profits at higher levels and supply exceeds demand.
That could pull the price down to the 50-day SMA ($258) and a crack below this support may extend the decline to $220.
DOT/USDT
The bears tried to trap the bulls on April 3, as seen from the long wick on the day’s candlestick. However, the bulls were not ready to surrender their advantage and they again pushed Polkadot (DOT) above $42.28 on April 4.
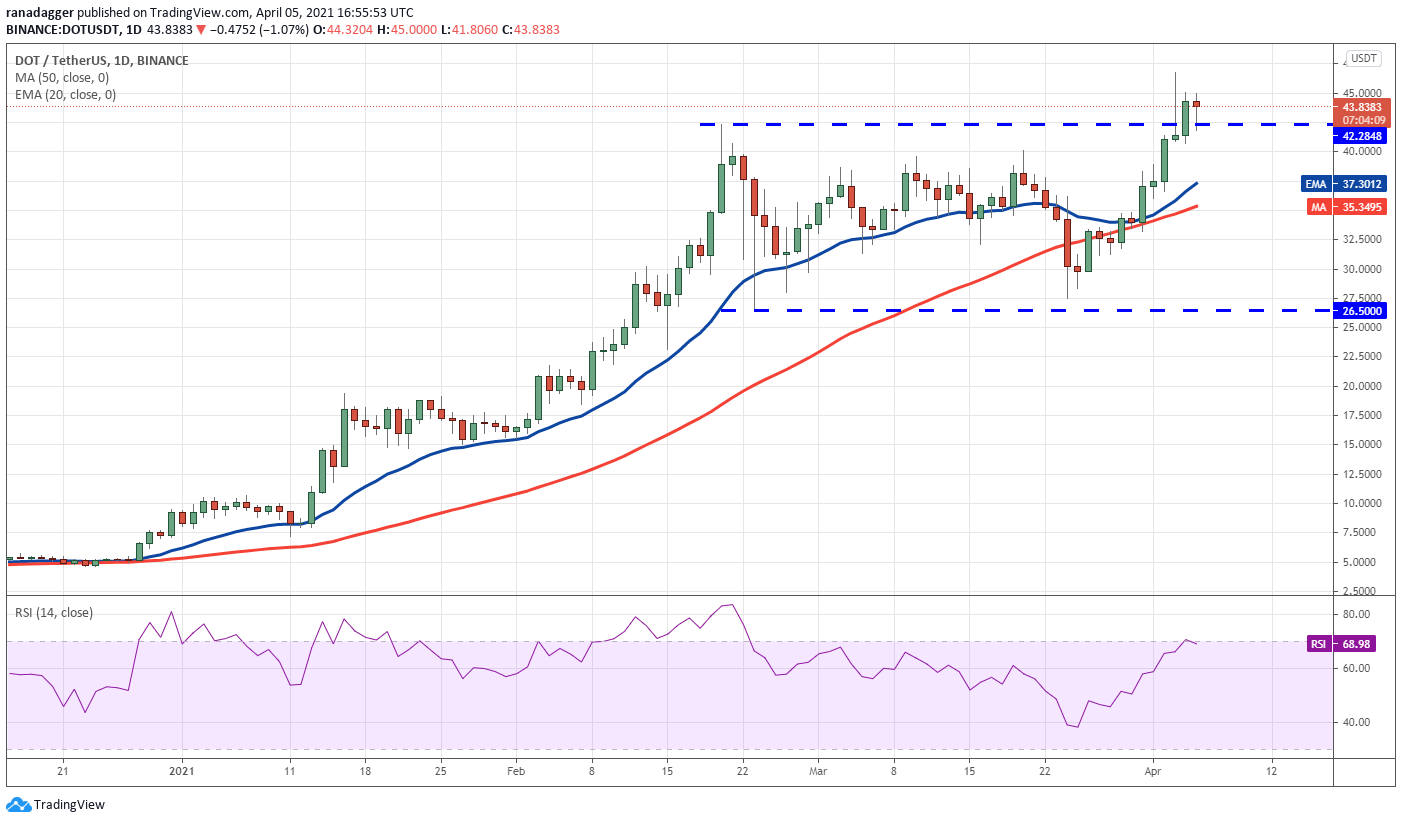
There is a tough tussle between the bulls and the bears near the $42.28 level. The buyers are trying to flip this level to support and launch the next leg of the uptrend, which could reach $53.50.
The upsloping 20-day EMA ($37.30) and the RSI near the overbought territory suggest the path of least resistance is to the upside.
This bullish view will invalidate if the bears can pull the price back below $40. If that happens, the ADA/USDT pair could drop to the moving averages and a break below the 50-day SMA ($35.34) could start a deeper correction to $26.50.
ADA/USDT
Cardano (ADA) has been trading near the 20-day EMA ($1.17) for the past few days. Attempts by the bulls to start an up-move on April 2 and 3 did not find buyers at higher levels as seen from the long wick on the candlesticks.
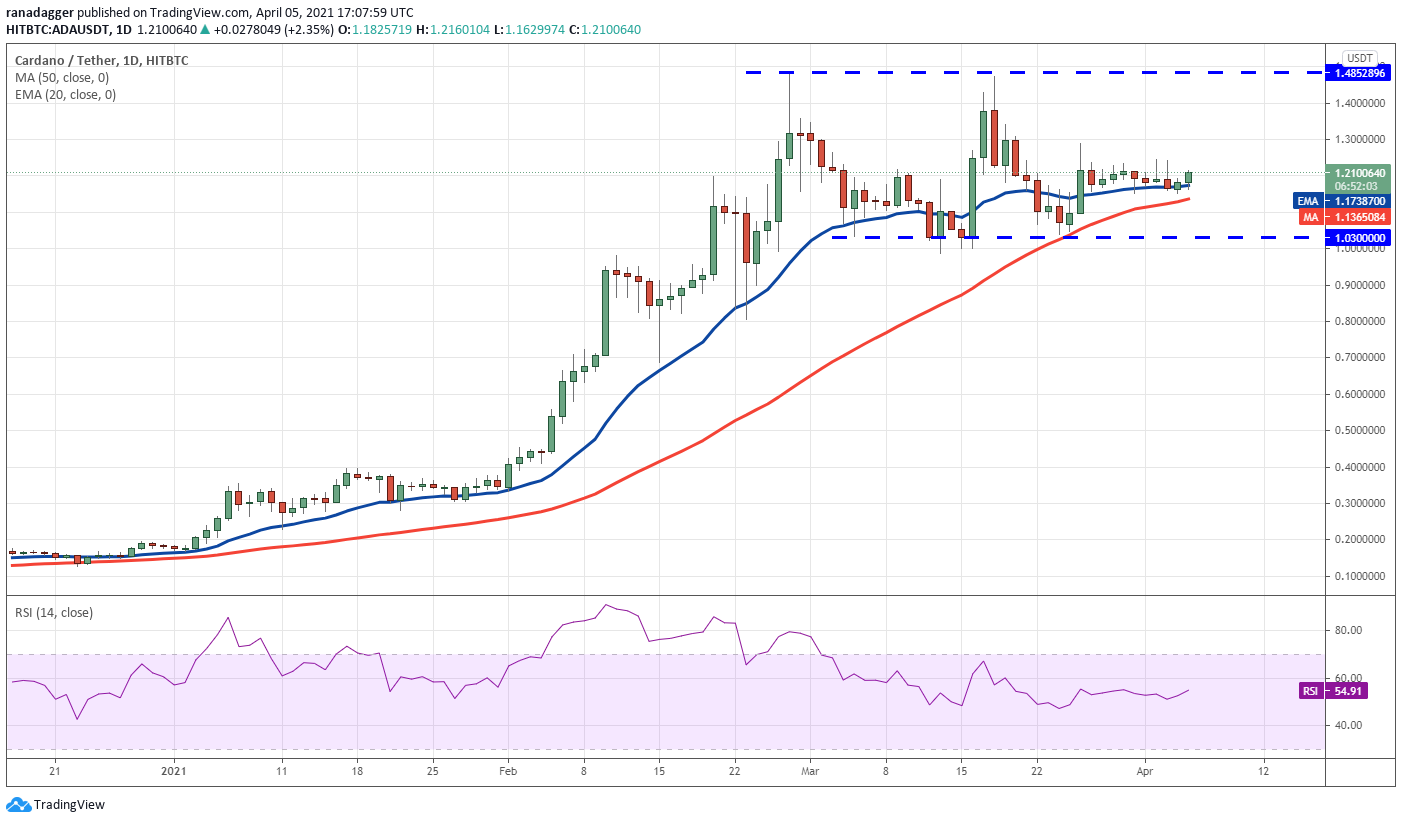
Usually, every low volatility phase is followed by a sharp increase in volatility but it is difficult to predict the direction of the breakout. Therefore, it is better to wait for the breakout to happen before initiating any trades.
If the bulls can push and sustain the price above $1.30, the ADA/USDT pair may challenge the stiff resistance at $1.48. This will be the third attempt to clear the overhead resistance, hence the possibility of a break above it is high. The next target objective is $2.
On the other hand, if the indecision resolves to the downside, the bears will try to sink the price below $1.03 and start a deeper correction to $0.80 and then $0.70.
XRP/USDT
XRP broke above the stiff overhead resistance at $0.65 today, which completed an inverse head and shoulders pattern. The altcoin picked up momentum and cleared the minor resistance at $0.75 and $0.78.
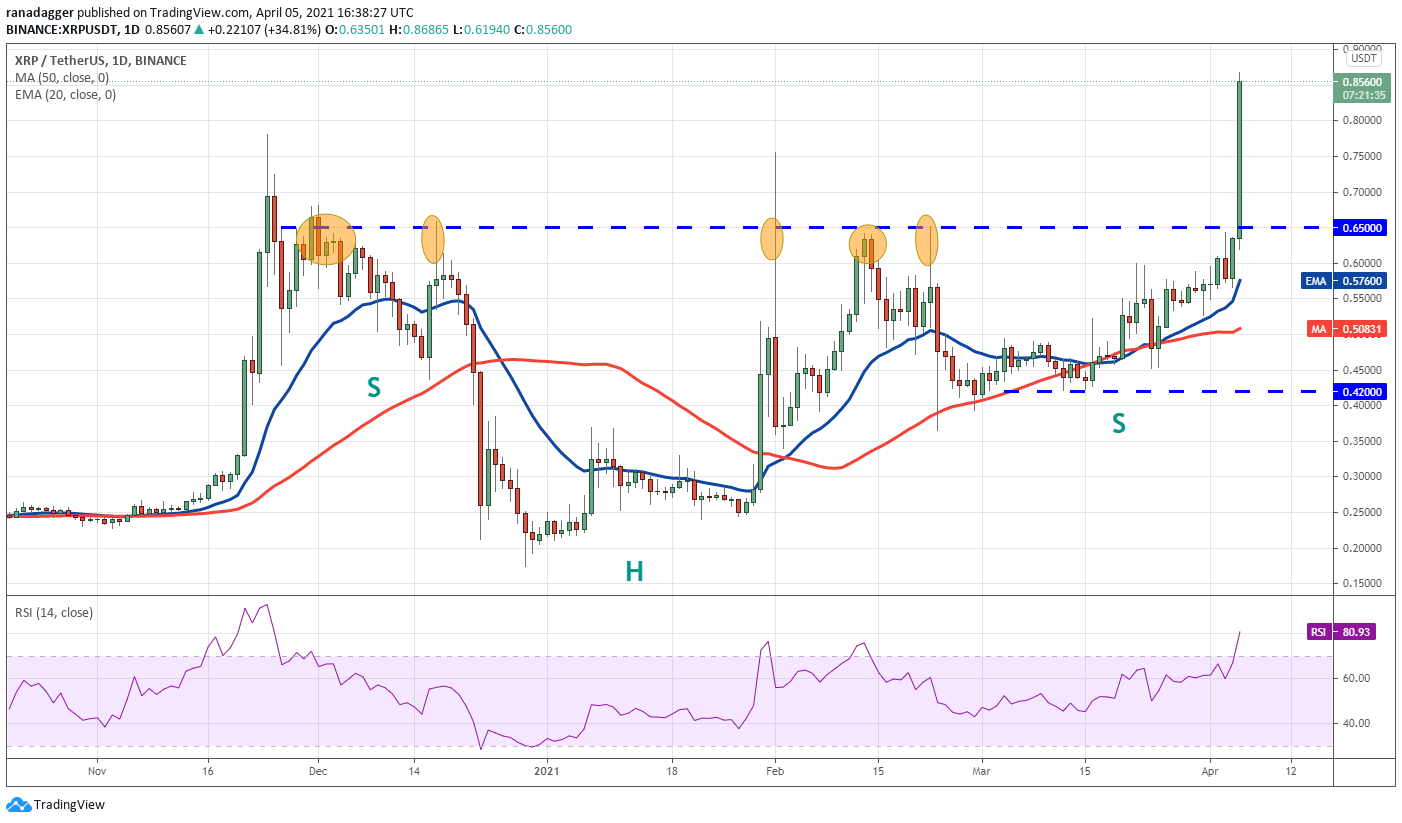
The sharp pace of the rally suggests that several bears may have been caught off guard, resulting in a massive short squeeze. This opens the possibility for a rally to the pattern target at $1.11.
The rising 20-day EMA ($0.57) and the RSI above 80 suggest the bulls are back in command.
However, the XRP/USDT pair may not rally to the target objective in a straight dash as short-term traders may book profits after the sharp rally today. That may pull the price down to the $0.75 to $0.65 support zone.
The strength of the rebound off this support zone will give a better insight into the next leg of the rally.
UNI/USDT
Uniswap (UNI) rose above the 20-day EMA ($29.52) on April 2 but the bears did not allow the price to run away. They sold at higher levels and pulled the price back to the 20-day EMA on April 3.
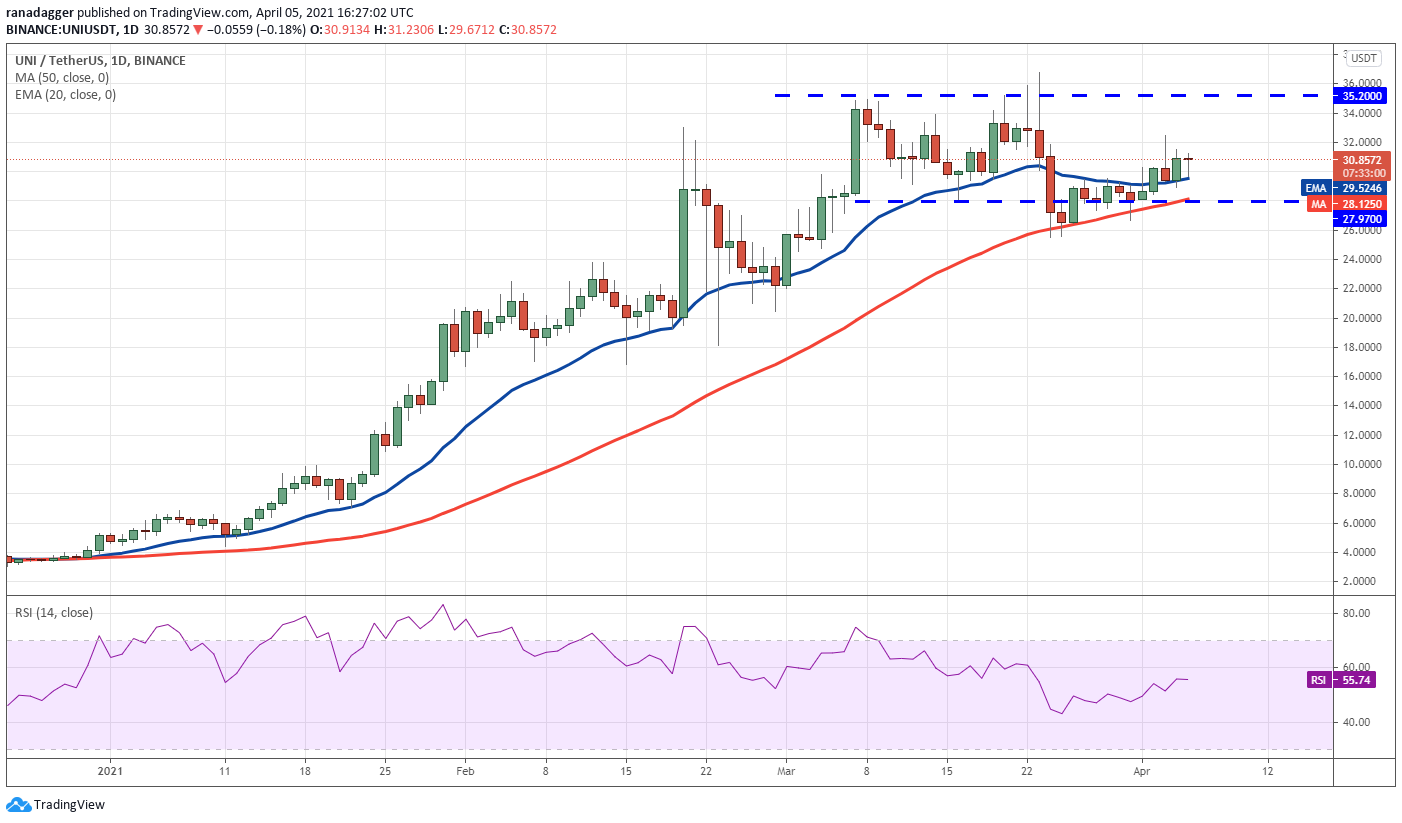
The positive sign is that the bulls have held the 20-day EMA successfully for the past three days. If the bulls can drive the price above $32.50, the UNI/USDT pair could rally to the $35.20 to $36.80 resistance zone.
The flattish 20-day EMA and the RSI below 56 suggests a lack of strong momentum in favor of the bulls. This could keep the pair range-bound for a few more days. The next trending move could start on a break above $36.80 or a break below $25.52.
LTC/USDT
Litecoin (LTC) had broken out of the resistance line of the symmetrical triangle on April 3 but the bulls could not sustain the higher levels. The altcoin quickly reversed direction and dropped back into the triangle.
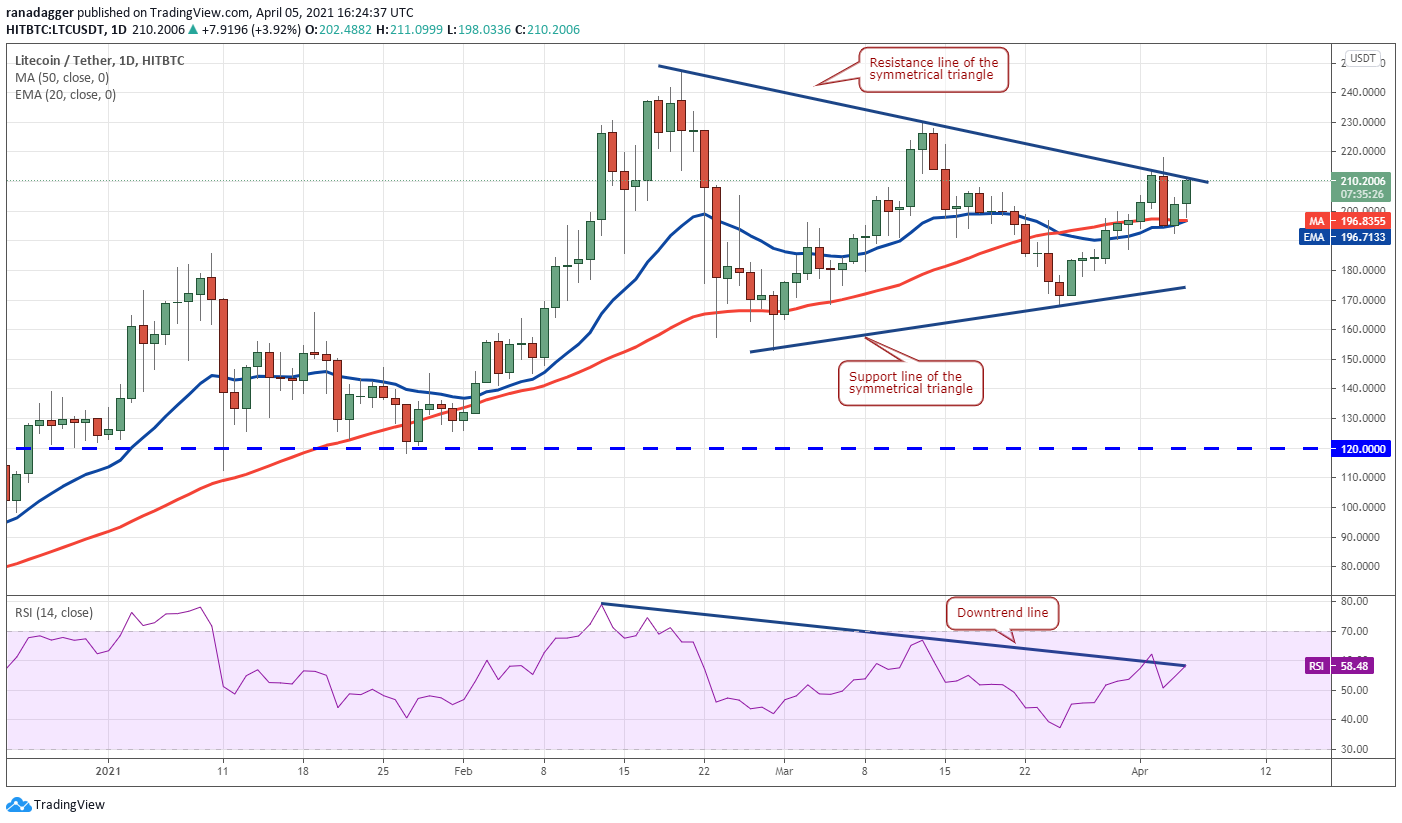
However, the positive sign is that the buyers did not allow the price to break below the moving averages. This shows that the bulls are accumulating on dips. They will again attempt to push and sustain the price above the triangle.
If they succeed, the LTC/USDT pair could rally to $230 and then to $246.96. Above this level, the pair could rise to the pattern target at $307.42.
Conversely, if the price once again turns down from the resistance line, then the possibility of a break below the moving averages increases. If that happens, the pair could drop to the support line of the triangle.
LINK/USDT
Chainlink (LINK) broke above the $32 resistance on April 2 but the bulls could not build upon this breakout and the bears pulled the price back into the range on April 3. This suggests the bears are aggressively defending the overhead resistance at $32.
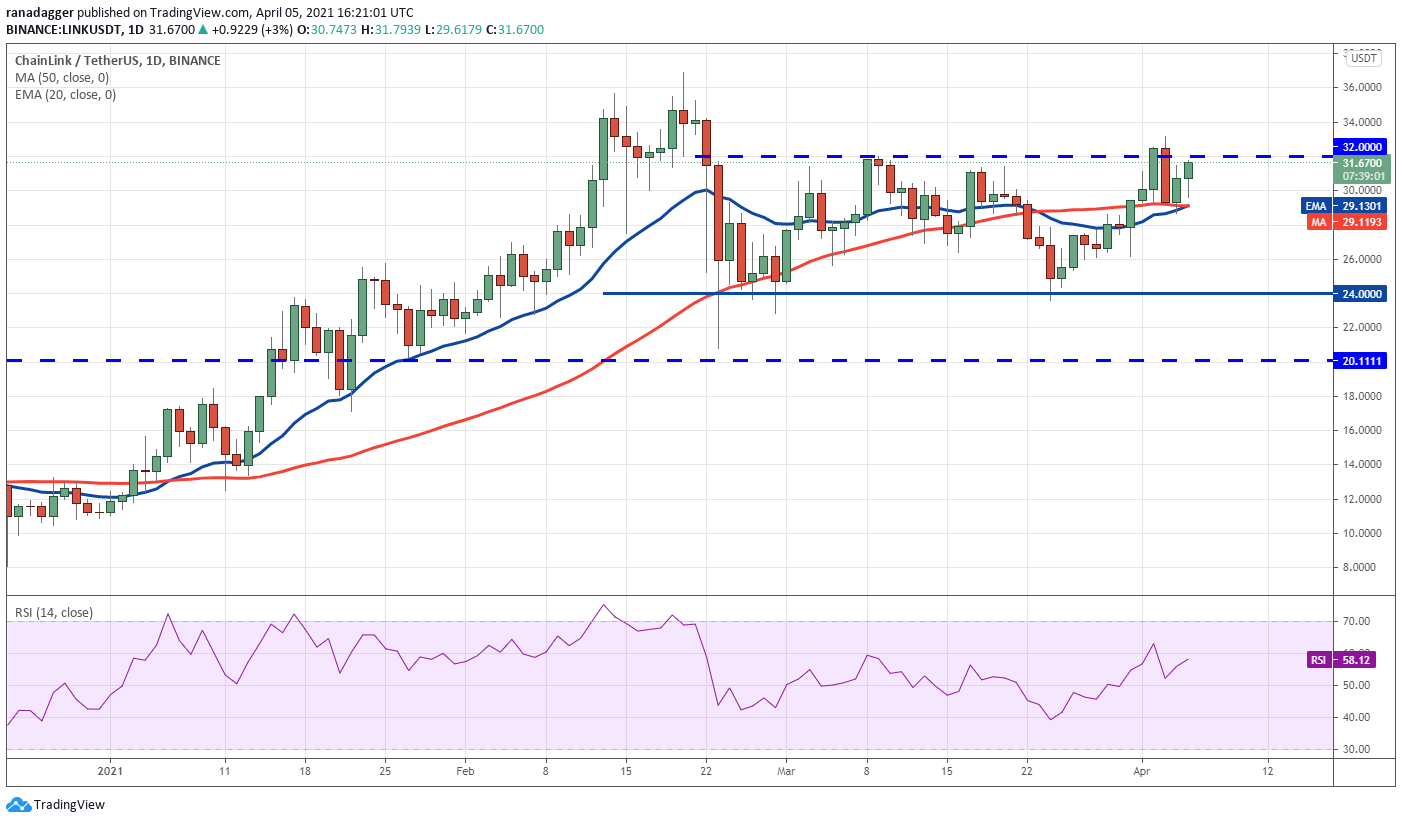
However, the strong rebound off the 20-day EMA ($29) on April 4 shows the bulls are buying the dips. The bulls will now try to thrust the price above the $32 to $33.17 overhead resistance zone.
If they can achieve that, the LINK/USDT pair may retest the all-time high at $36.93. If this level is also conquered, the rally may extend to $40.
On the contrary, if the price again turns down from the overhead resistance zone and plummets below the moving averages, it will suggest that the range-bound action may continue for a few more days.
THETA/USDT
THETA has been stuck inside the $10.35 to $14 range for the past few days. The bears are trying to sink the price to the support of the range but the bulls have not allowed the altcoin to dip below $11.20.
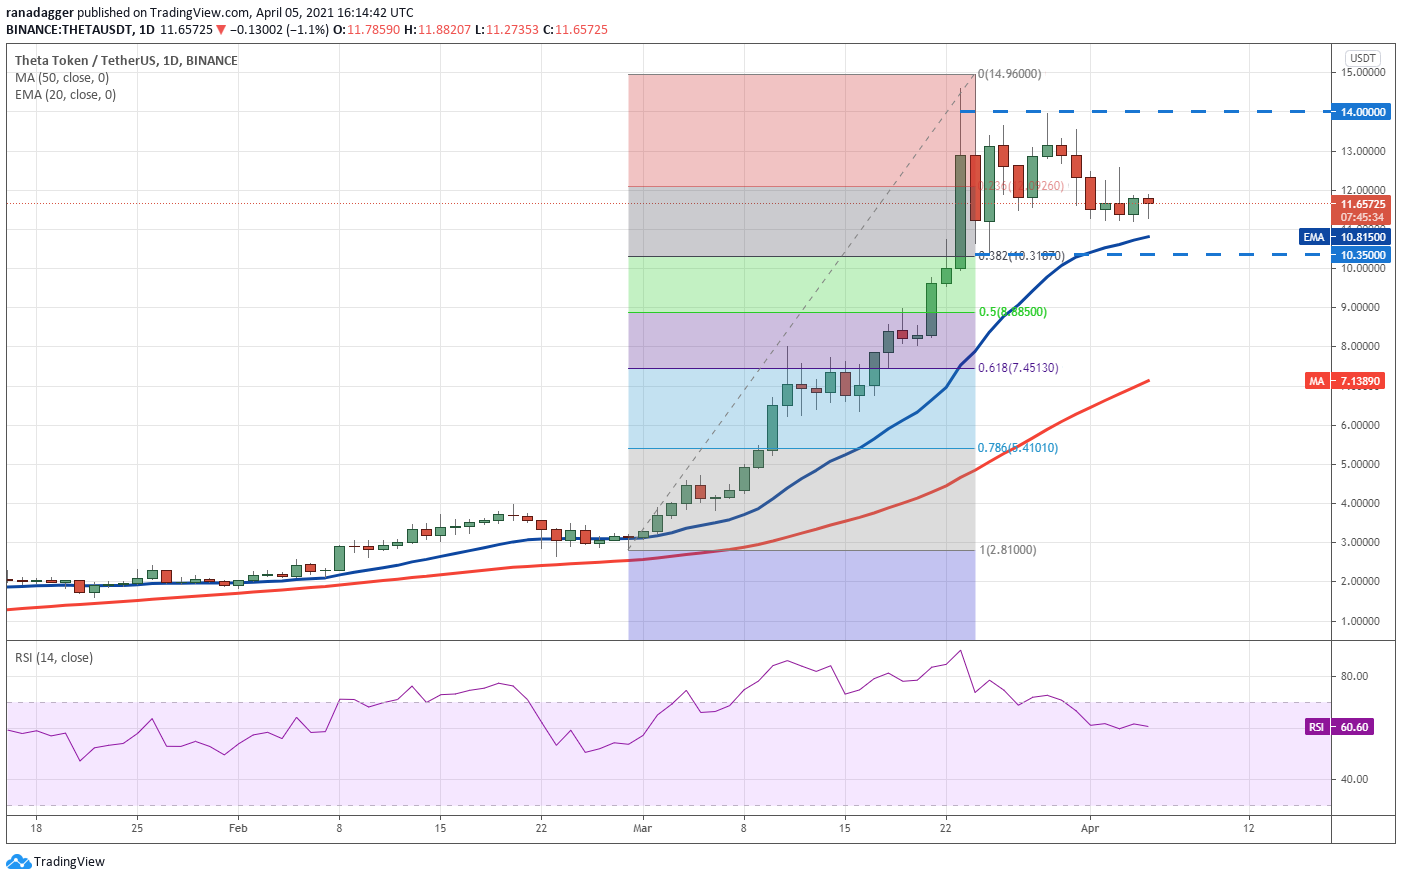
The 20-day EMA ($10.81) is gradually flattening out and the RSI has dropped below 61, pointing to a possible range-bound action in the next few days.
Contrary to this assumption, if the bulls can drive the price above $12.58, the THETA/USDT pair could rally to $14. A breakout of this resistance will be the first sign that bulls have the upper hand.
However, if the pair turns down from the current level and slips below $11.20, a drop to $10.35 is possible. A break below this support could intensify selling.
The views and opinions expressed here are solely those of the author and do not necessarily reflect the views of Cointelegraph. Every investment and trading move involves risk. You should conduct your own research when making a decision.
Market data is provided by HitBTC exchange.


