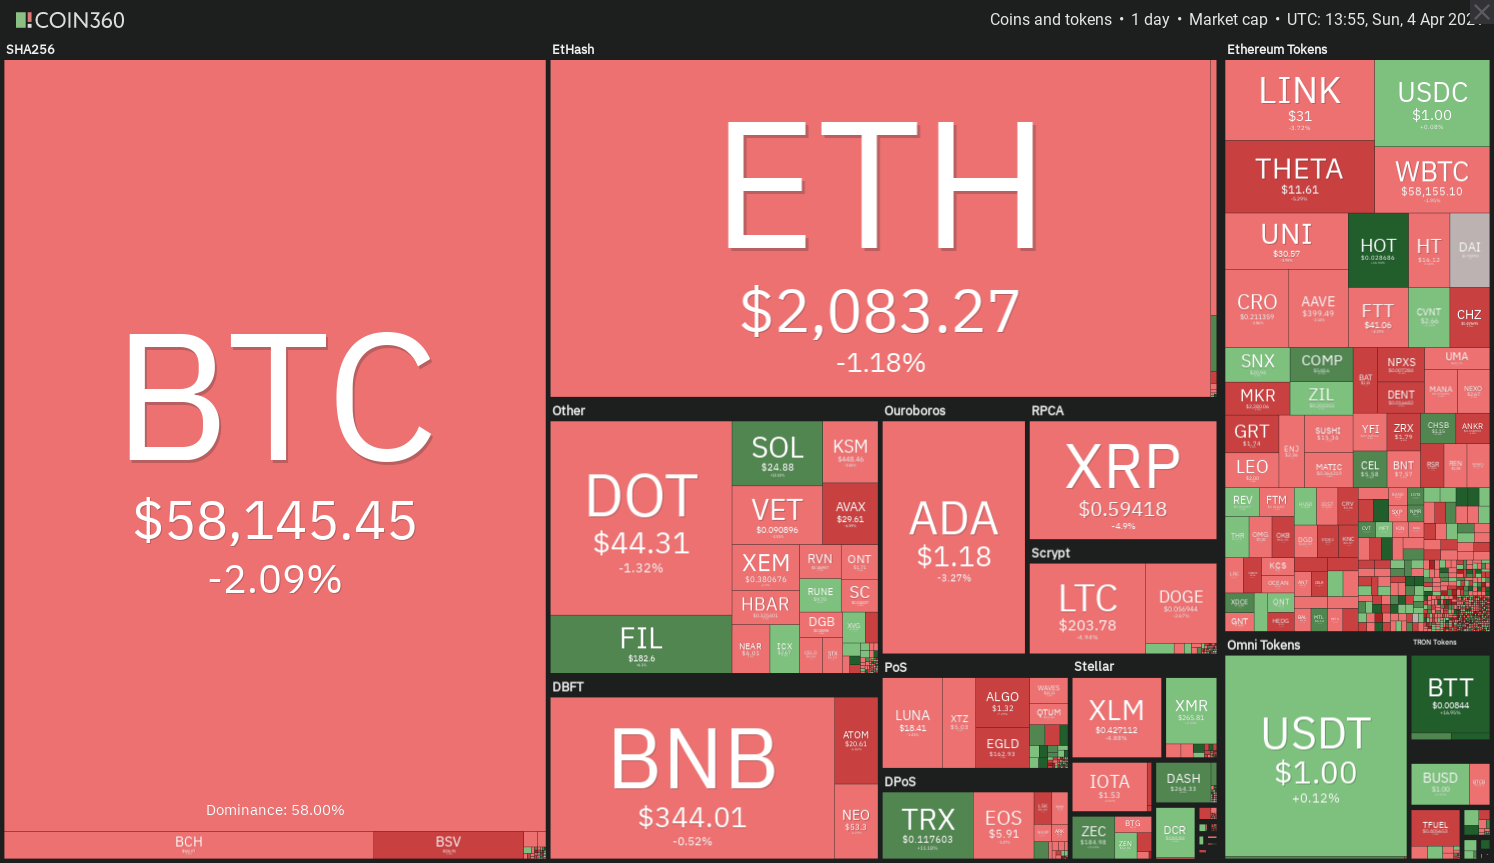
Historical trends act as a gauge for traders to assess the possibilities for the future. April has been a bullish month for Bitcoin (BTC) with eight monthly closes in the green and only two instances of negative returns.
Danny Scott, the CEO of the Bitcoin exchange CoinCorner, said that Bitcoin could rally to $83,000 if it emulates its average April return of 51% as it had over the past 10 years.
This could be one of the reasons why miners have started holding their positions instead of selling at the current levels. Lex Moskoviski, the CIO at Moskoviski Capital, recently highlighted that miners had hoarded 4,380 Bitcoin on April 2 and 4,494 Bitcoin on April 3.
While Bitcoin remains the undisputed leader, a positive is that some mainstream companies have started to explore opportunities in different sectors of the crypto sector.
Shopify CEO Tobi Lutke indicated that his company was exploring ways to integrate with decentralized finance. On April 3, Lutke tweeted a question to the DeFi community asking for ideas on what role the company could play in the space. If something concrete comes of this it could give a big boost to the entire crypto ecosystem.
Let’s study the charts of top-5 cryptocurrencies that may outperform the other major cryptocurrencies in the short term.
BTC/USDT
Bitcoin’s repeated failure to break above the $60,000 level in the past few days could have attracted profit-booking from short-term traders. That resulted in a drop to the 20-day exponential moving average ($56,518) today.
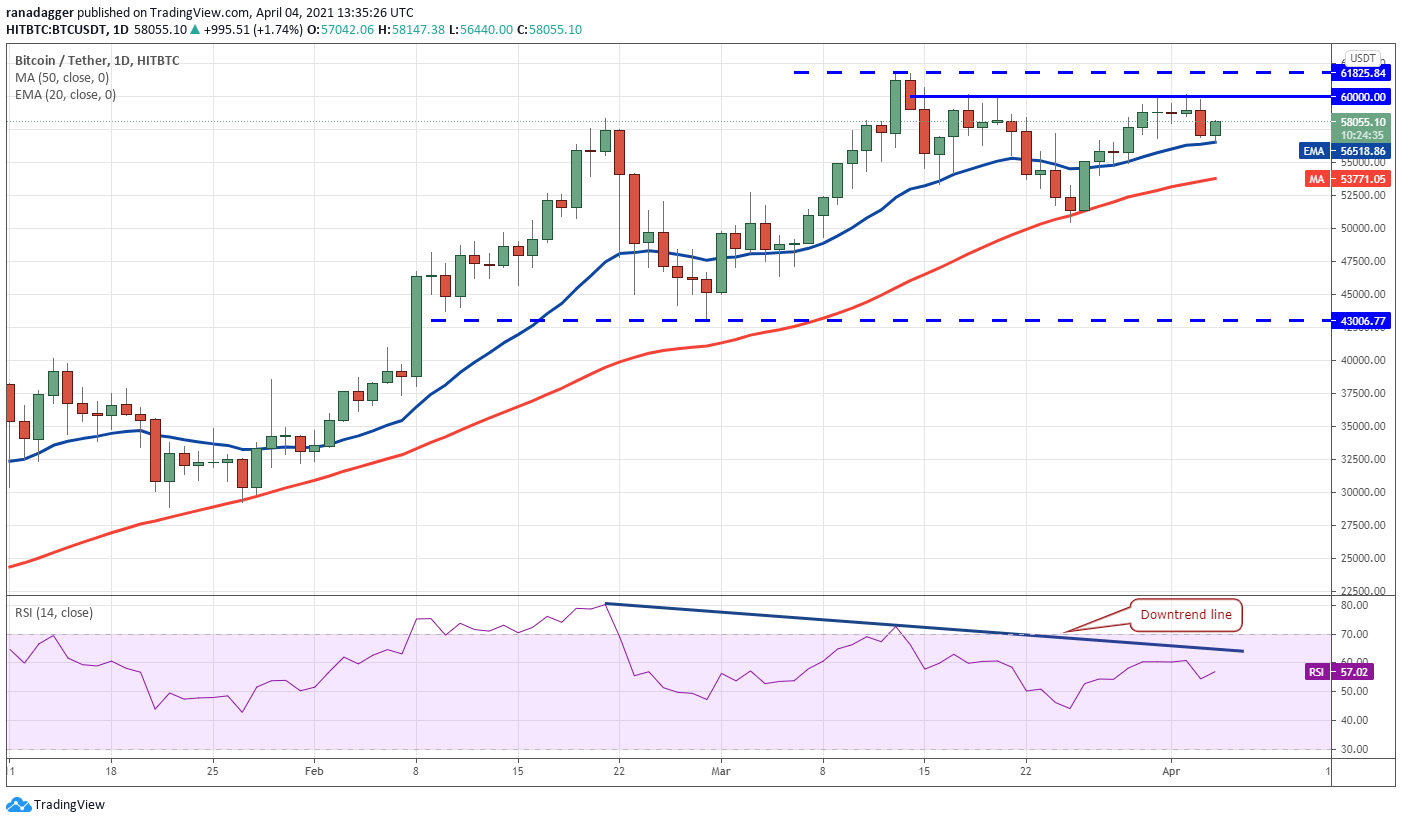
The moderating of the slope of the moving averages and the failure of the relative strength index (RSI) to rise above the downtrend line shows that bears are aggressively defending the $60,000 to $61,825.84 resistance zone.
If the bulls can thrust the price above this zone, it could trap the bears, resulting in a possible short squeeze. That could boost momentum, launching the BTC/USDT pair toward the target objective at $69,540 and then $79,566.
On the other hand, if the bulls again fail to clear the hurdle at $60,000, then the possibility of a break below the 20-day EMA increases. The pair could then retest the 50-day simple moving average ($53,771). This is an important support to watch out for because a break below it will indicate a possible change in the short-term trend.
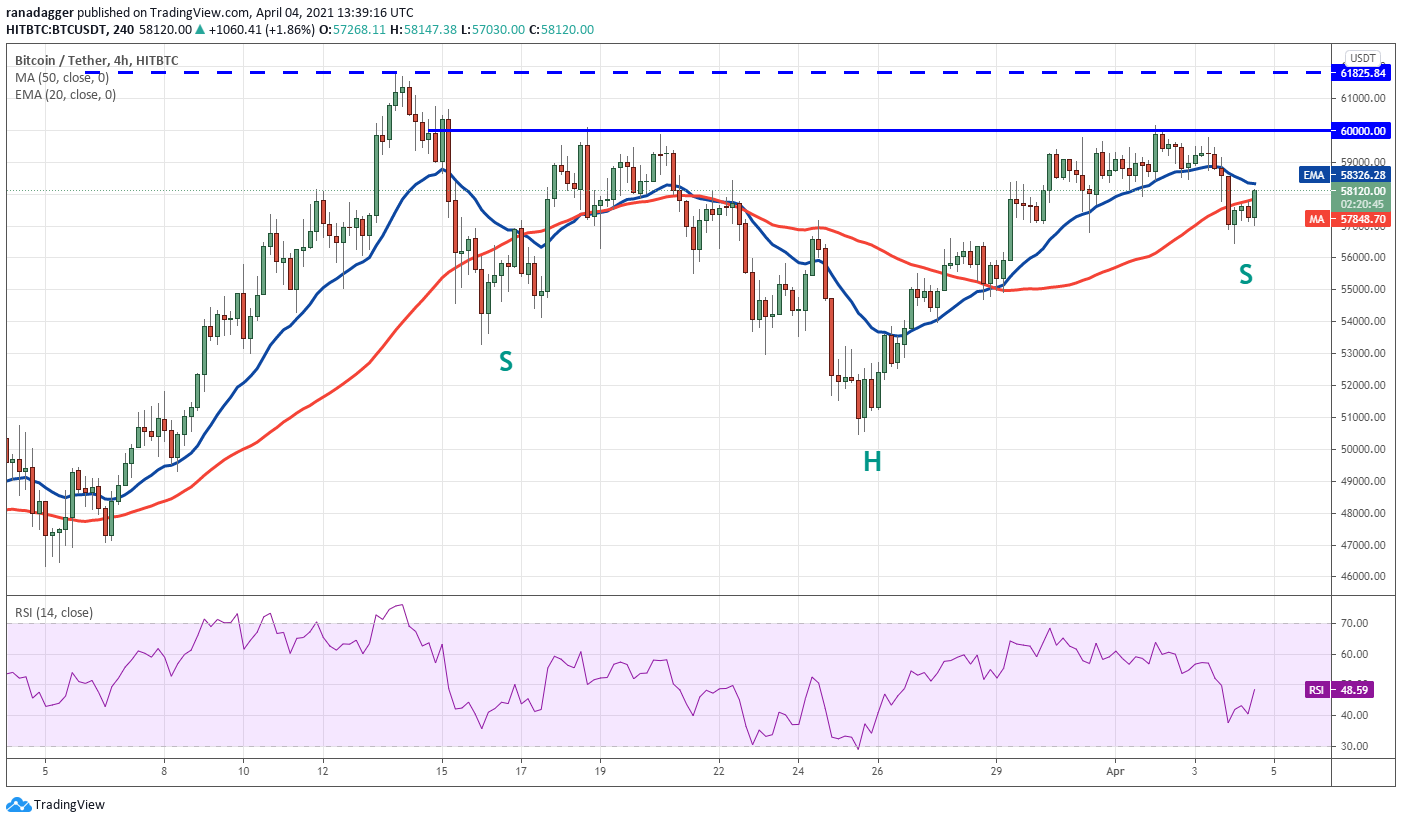
The 4-hour chart shows the formation of a possible inverted head and shoulders pattern that will complete on a breakout and close above $60,000. This bullish setup has a pattern target of $69,540.
However, the 20-EMA has started to turn down, indicating the bears are trying to gain the upper hand. If the price turns down from the 20-EMA, the pair could extend its decline to $54,700. A break below this level could open the doors for a decline to $50,460.02.
ETH/USDT
The range-bound action in Ether (ETH) resolved to the upside on April 2 and the price surged to a new all-time high at $2,144.59. However, the bulls could not sustain the higher levels as the price again dipped back below the breakout level at $2,040.77.
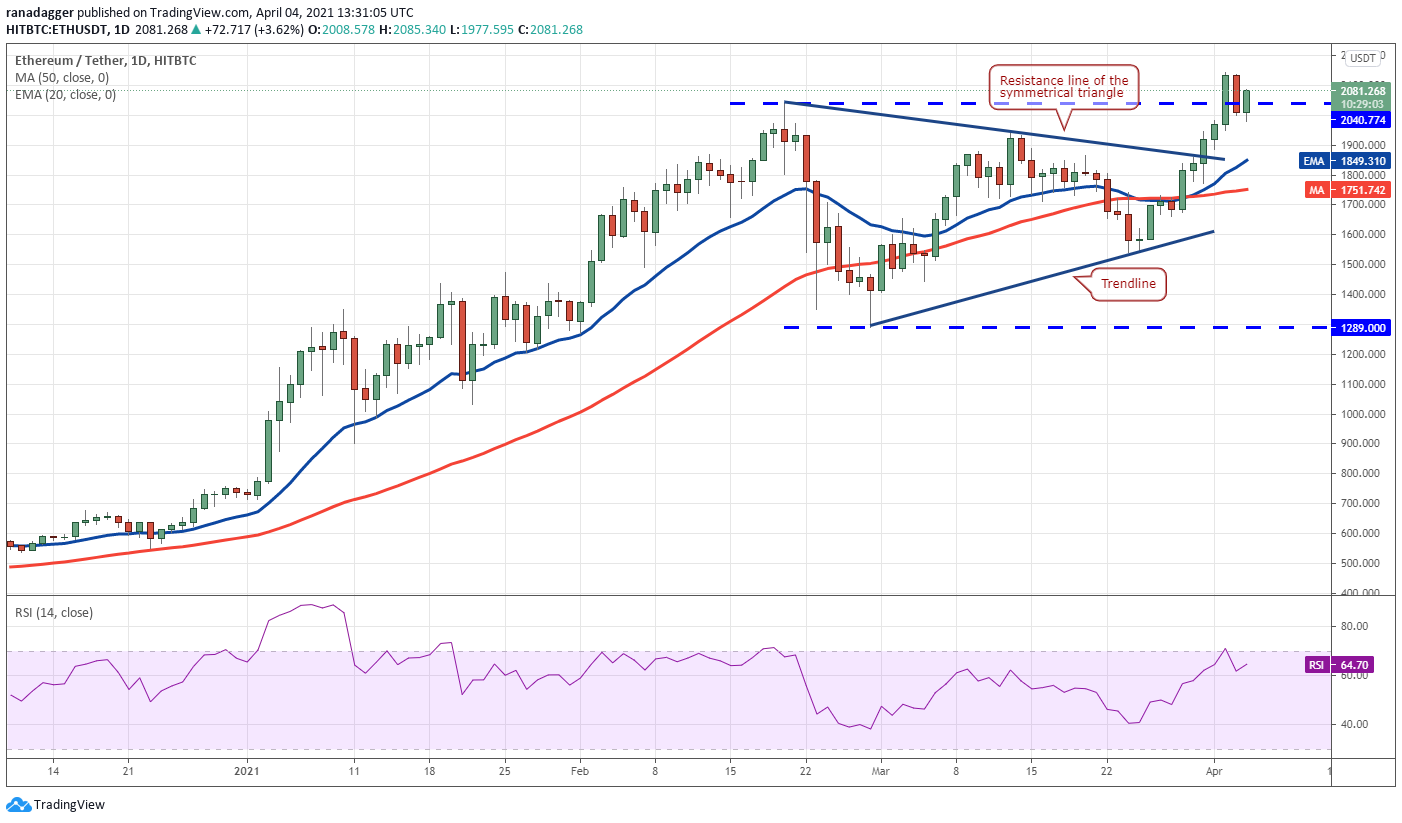
The bulls are currently attempting to push the price back above the $2,040.77 to $2,144.59 overhead resistance zone. If they succeed, the ETH/USDT pair could pick up momentum and start its journey to $2,618.14.
The upsloping 20-day EMA ($1,849) and the RSI in the positive zone indicate the bulls have the upper hand.
However, if the price turns down from the overhead zone and dips below the 20-day EMA, it will suggest that the bullish momentum has weakened. A break below the 50-day SMA ($1,751) could keep the pair range-bound between $1,289 and $2,040.77.
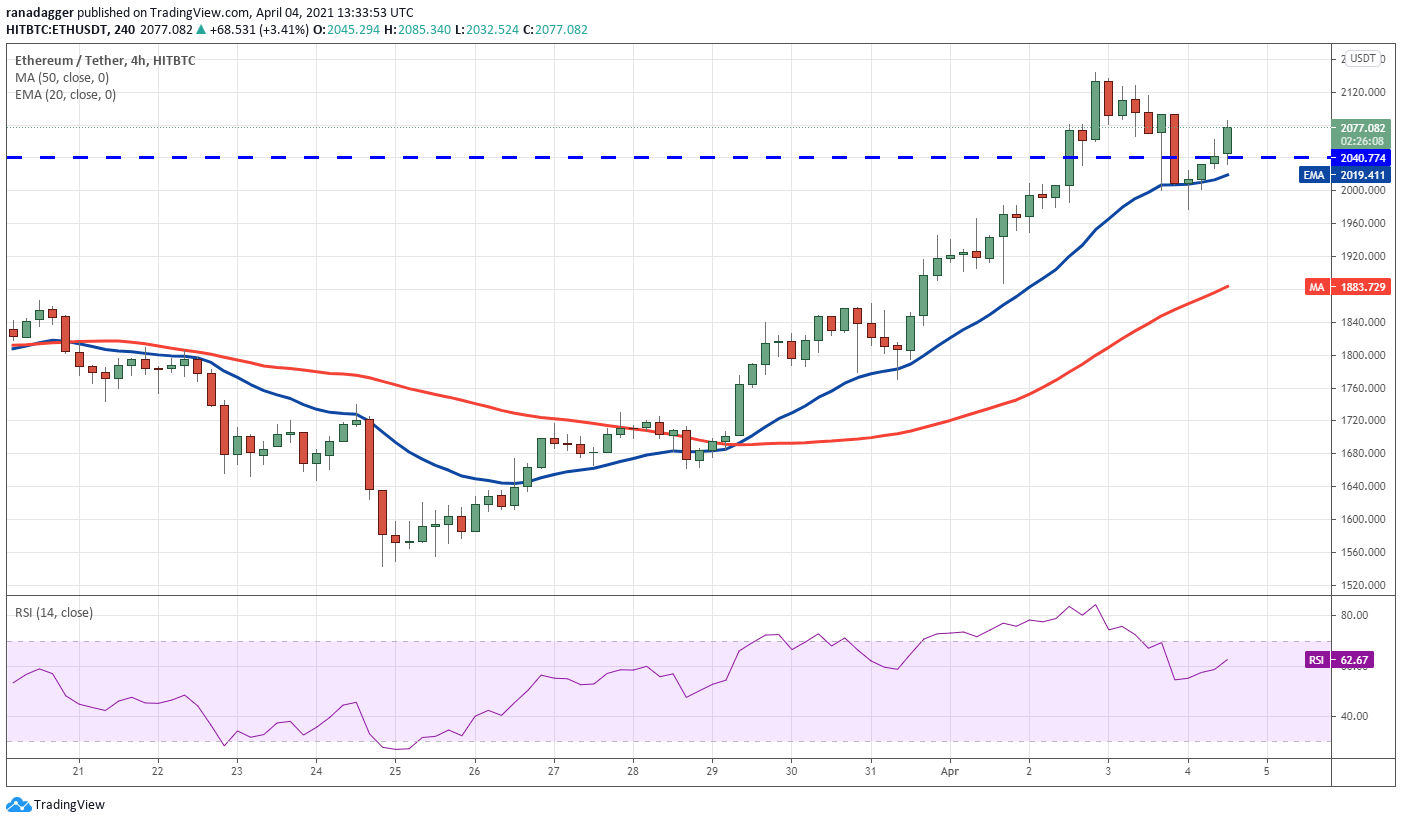
The 4-hour chart shows the pullback in the pair has found support at the 20-EMA, which suggests the uptrend is intact. However, the bears are unlikely to give up easily. They will again try to stall the current rally in the $2,093.45 to $2,144.59 overhead resistance zone.
If they succeed, the pair may again drop to the 20-EMA. A break below this support will be the first indication that supply exceeds demand.
On the contrary, if the bulls can sustain the rebound and catapult the price above the resistance zone, the uptrend may resume.
BNB/USDT
Binance Coin (BNB) broke out to a new all-time high on April 2 but the bulls could not sustain the higher levels and the price dipped back below $348.69. This suggests that the bears tried to trap the aggressive bulls.
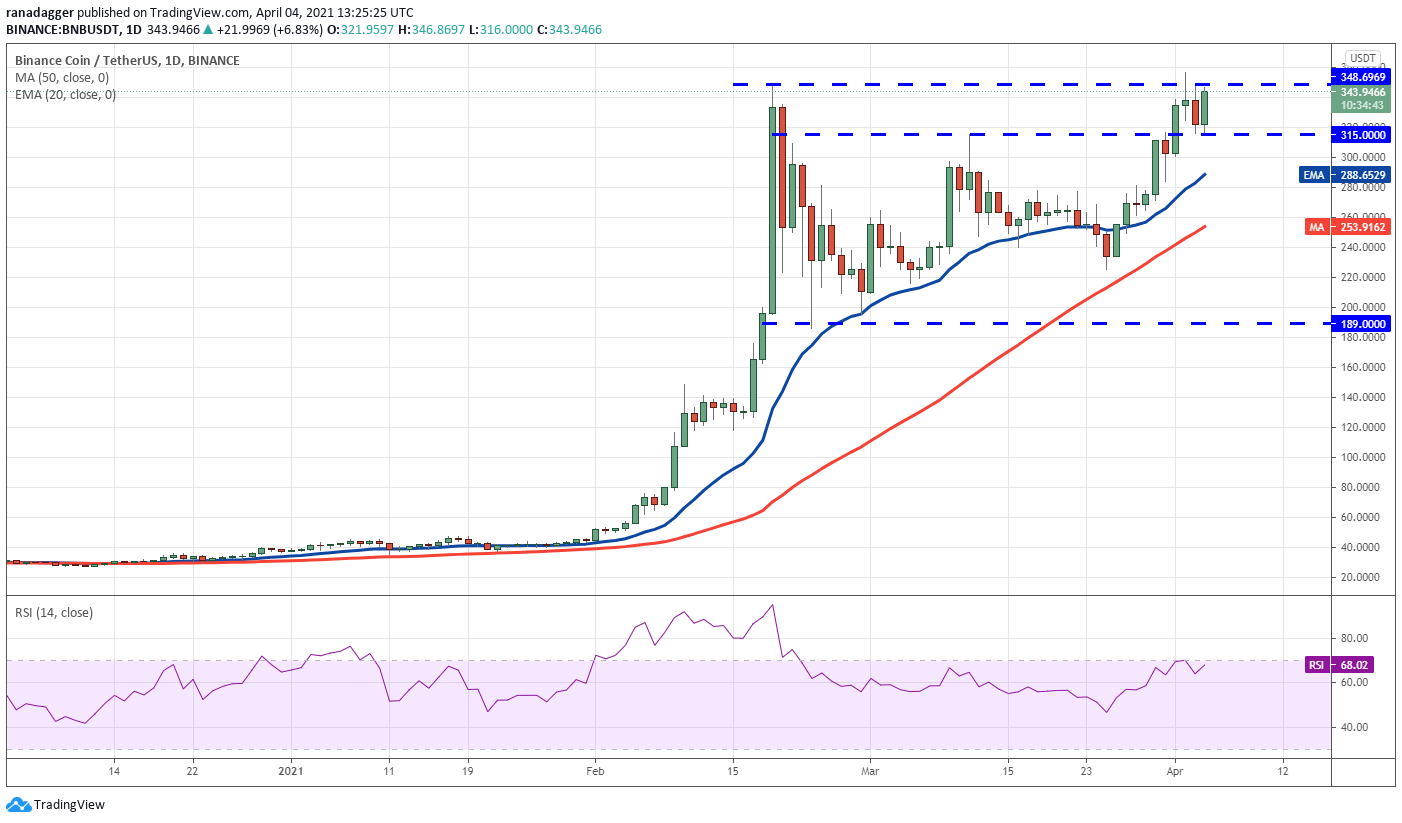
However, the bulls did not allow the price to break below the $315 support. This is a positive sign as it indicates that bulls are accumulating on every minor dip and are not waiting for a deeper correction to buy.
If the bulls can thrust the price above the all-time high at $356.98, the BNB/USDT pair could start the next leg of the uptrend that may reach $400 and then $430. The rising moving averages and the RSI near the overbought territory suggest the path of least resistance is to the upside.
On the contrary, if the price turns down from the current level or the overhead resistance and slides below $315, it will suggest that the bullish momentum is weakening.
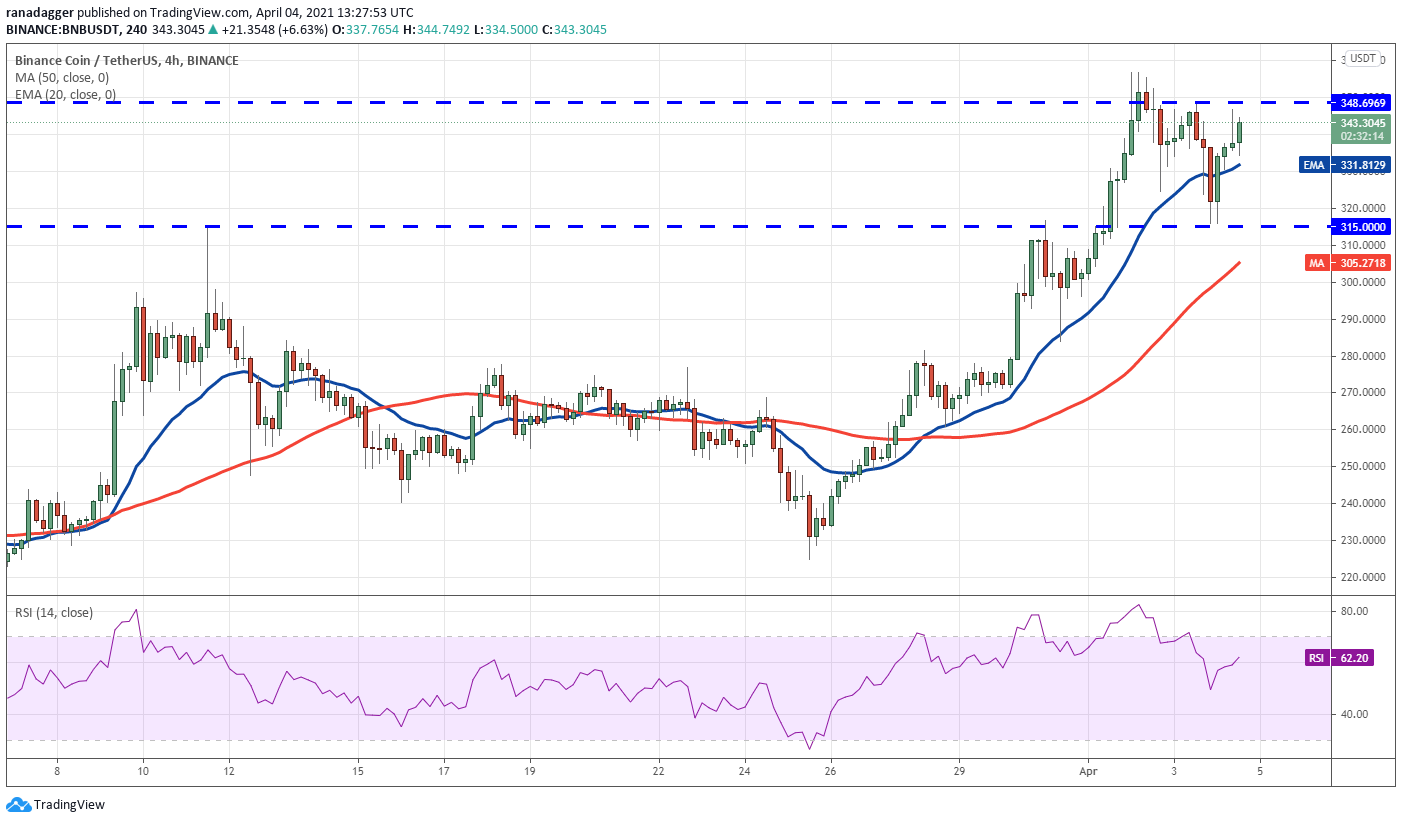
The 4-hour chart shows the bears are aggressively defending the overhead resistance zone between $348.69 and $356.98. They had even pulled the price below the 20-EMA but could not break the $315 support.
The bulls will now make one more attempt to push the price above $356.98 and if they succeed, the pair could pick up momentum.
On the other hand, even if the price turns down from the overhead resistance zone but stays above $315, it will indicate strength. The bears could gain the upper hand in the short term if the price breaks and sustains below $315.
DOT/USDT
Polkadot (DOT) broke above the downtrend line on April 2 and made a new all-time high at $46.80 on April 3. However, the higher levels attracted profit-booking as seen from the long wick on the day’s candlestick.
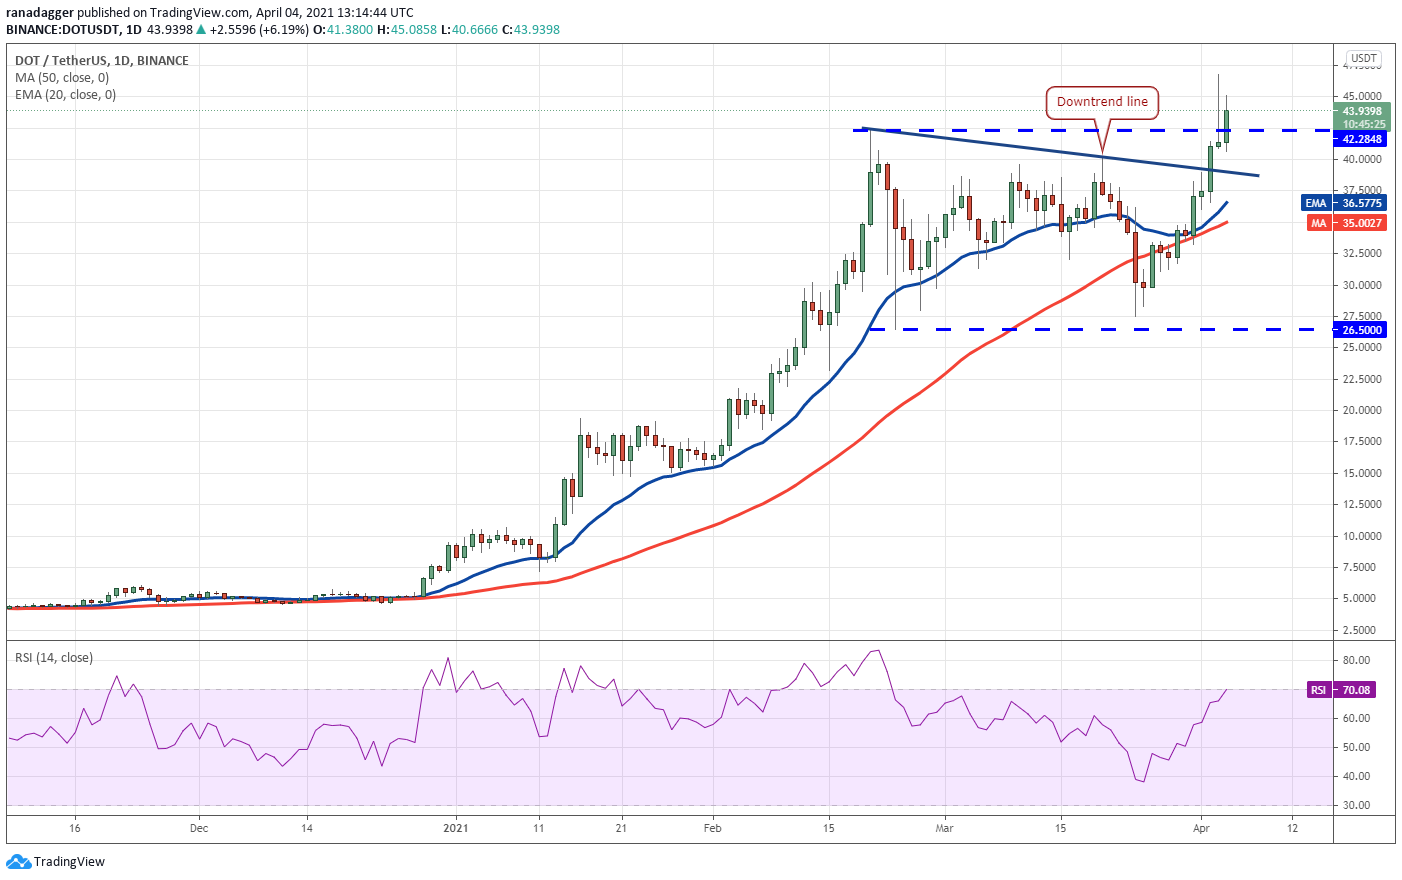
The bears could not build upon their advantage as the bulls purchased at lower levels and have pushed the price back above $42.28 today.
The 20-day EMA ($36.57) has turned up and the RSI has risen into the overbought zone, indicating the bulls are in control.
If the bulls can now drive the price above $46.80, the DOT/USDT pair could resume the uptrend and rally to the target objective at $53.50.
This positive view will invalidate if the price turns down and breaks below the moving averages.
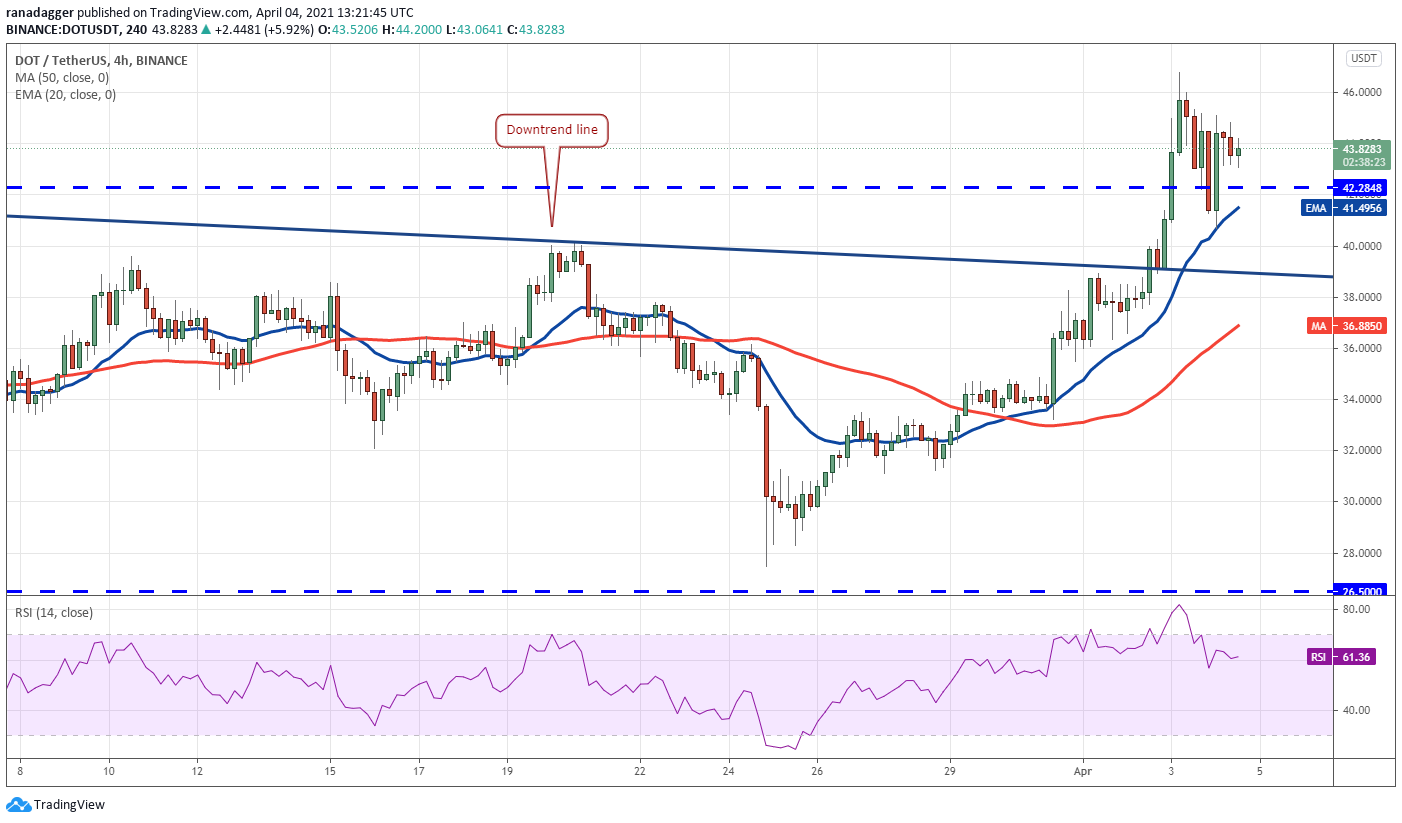
The moving averages are sloping up and the RSI is in the positive zone, indicating that the short-term trend is bullish. The strong rebound off the 20-EMA indicates that the bulls are aggressively accumulating on dips. This increases the possibility of a break above $46.80.
However, if the price turns down from the current levels and breaks below the 20-EMA, it will suggest that supply exceeds demand. Such a move could pull the price down to the 50-SMA.
EOS/USDT
EOS broke above the $5.60 overhead resistance on April 1 and closed at $6.25 on April 2, its highest close since June 29, 2019. This shows that the altcoin is once again generating interest among investors.
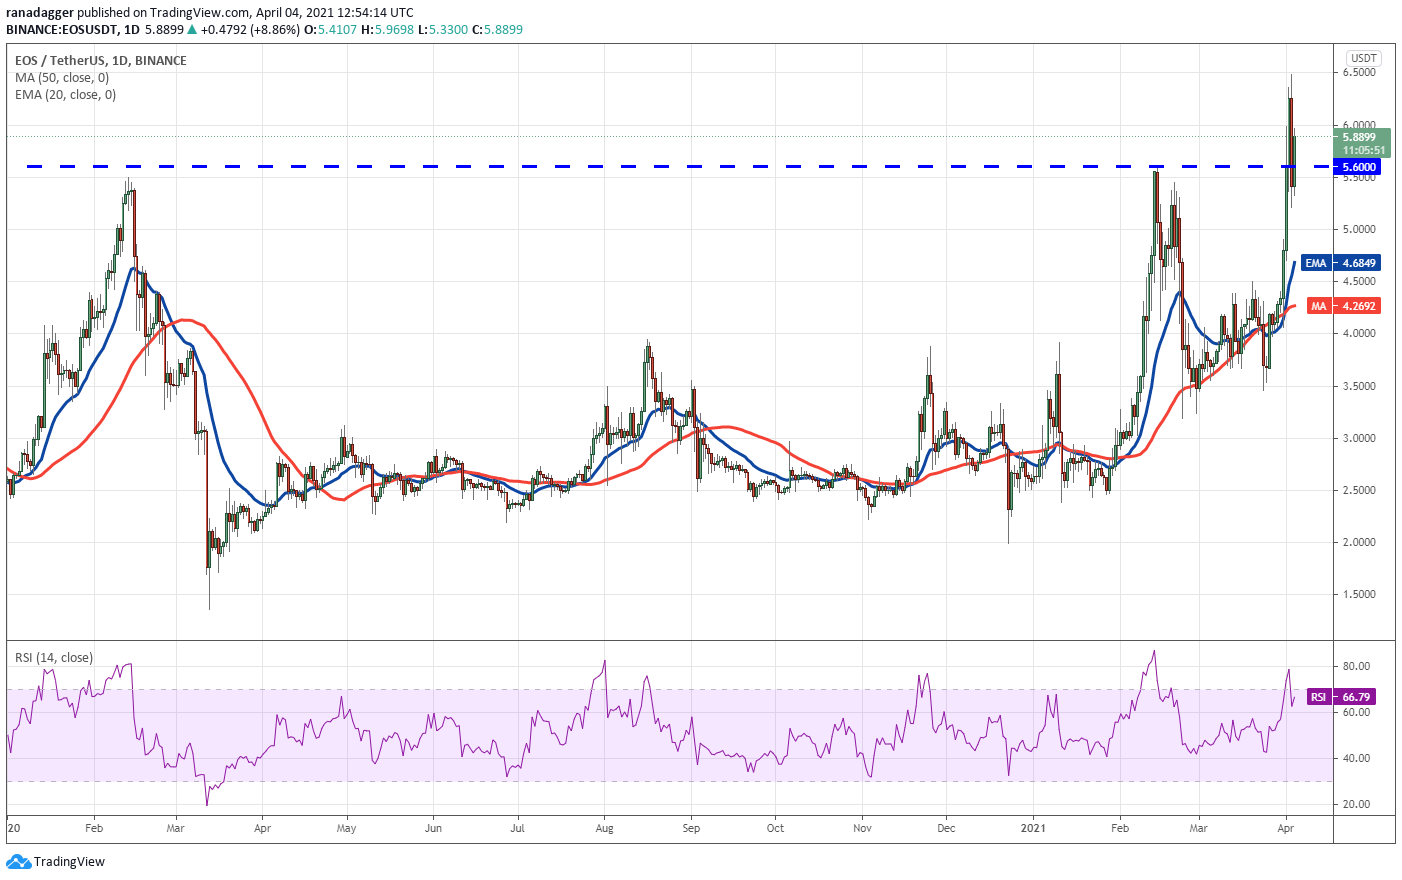
The bears dragged the price back below the breakout level of $5.60 on April 3, but the positive sign is that the bulls have not allowed the bears to assert their dominance. They have again pushed the price back above $5.60.
If buyers can sustain the price above $5.60 for three days, it will suggest the start of a new uptrend. The EOS/USDT pair is likely to pick up momentum after the bulls propel the price above $6.50. If they can do that, the pair could rally to $7.64 and then $8.69.
The 20-day EMA ($4.68) has started to turn up and the RSI is in the positive territory, indicating the bulls have the upper hand.
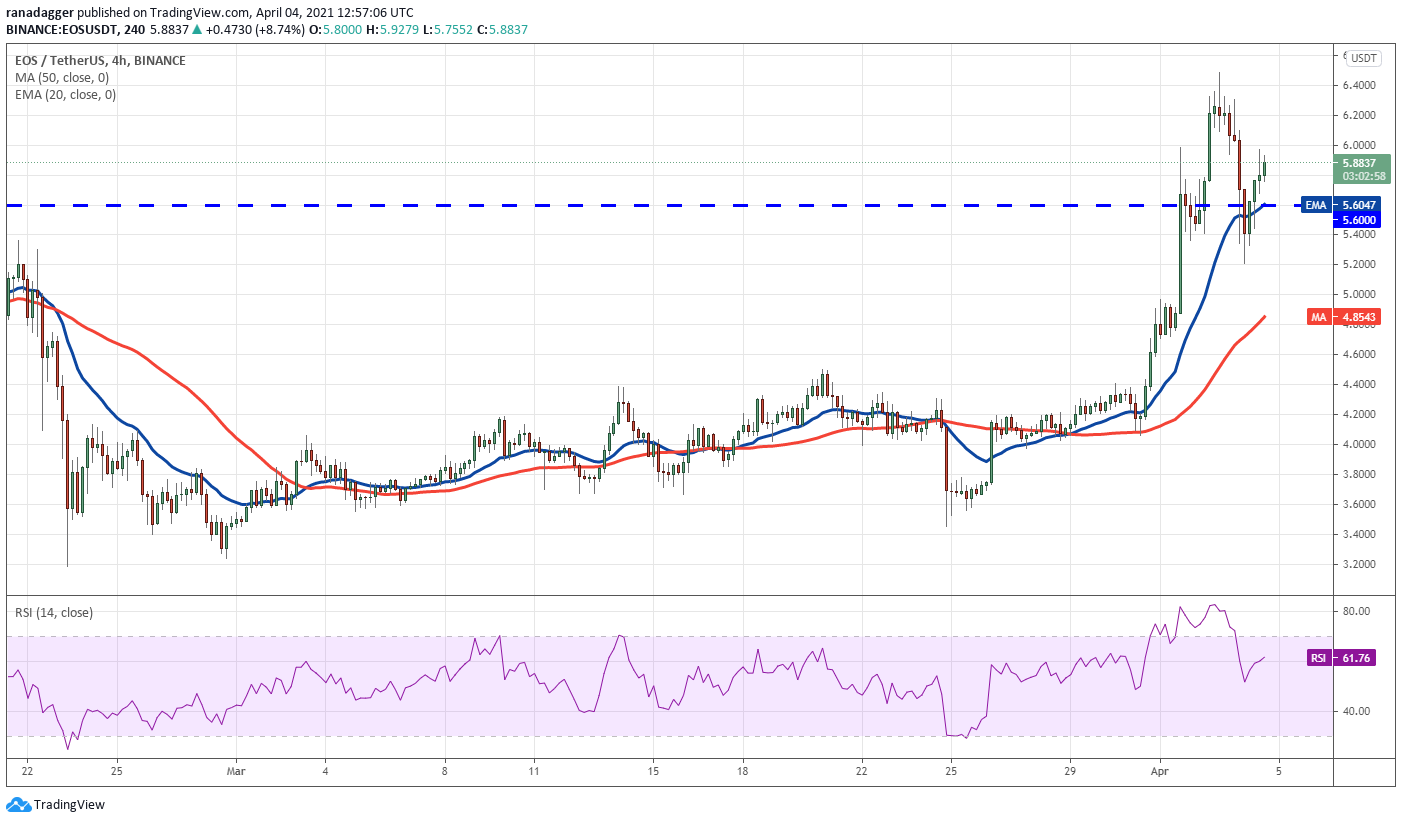
The 4-hour chart shows the bears attempted to trap the bulls when they pulled the price back below the 20-EMA and $5.40. However, the buyers did not give up and they successfully defended the $5.20 level.
This shows the bulls are buying on dips. The 20-EMA has started to turn up and the RSI is in the positive zone, suggesting advantage to the bulls. If they can sustain the price above $5.60, the possibility of a breakout of $6.48 increases.
Contrary to this assumption, if the price turns down and breaks below $5.20, it will suggest that the breakout above $5.60 was a bull trap.
The views and opinions expressed here are solely those of the author and do not necessarily reflect the views of Cointelegraph. Every investment and trading move involves risk, you should conduct your own research when making a decision.


